Fig. 3
- ID
- ZDB-FIG-180105-24
- Publication
- Wu et al., 2017 - Fine-tune regulation of carboxypeptidase N1 controls vascular patterning during zebrafish development
- Other Figures
- All Figure Page
- Back to All Figure Page
|
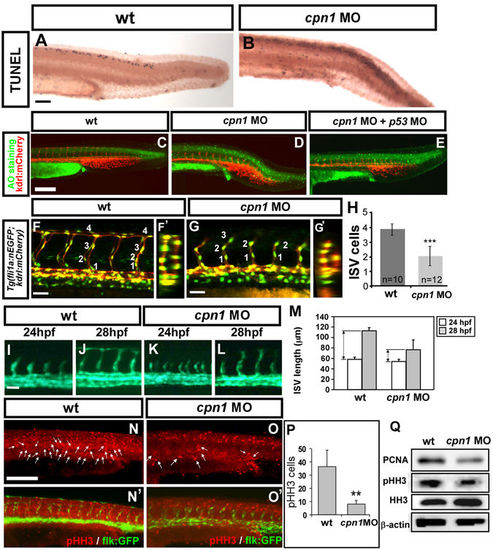
Knockdown of cpn1 impairs the growth of ISV cells. (A–E) TUNEL assay and acridine orange (AO) staining was used to detect apoptotic cells in wt and cpn1 morphants. (A,B) Apoptotic cells (black dots) were observed in the dorsal region, but not in the vasculature in cpn1 morphants. (C–E) Representative images of AO staining in uninjected control (C), cpn1 morphants (D) and cpn1 MO co-injected with p53 MO (E) on Tg(kdrl:mCherry)ci5 fish. Some increased apoptotic cells were observed on the skin and at the epidermis of the tail region in cpn1 MO (D), but not in the vasculature as compared to controls (C). Co-injection of cpn1 MO with p53 MO showed a reduction of apoptotic cells but still caused vascular defects in ISV and CVP (E). (F,F′,G,G′) Lateral and cross-sectional views of confocal images of Tg(kdrl:mCherry ci5; fli1a:nEGFP y7) embryos with cpn1 MO injection (G,G′) and uninjected control (F,F′) at 30hpf. (H) Quantification of the average number of cells per ISV in wt (n = 10) and cpn1 MO (n = 12) at 30 hpf. (I–L) Migration assay is used to measure the difference of ISV length from 24 hpf to 28 hpf in wt control and cpn1 MO (n = 6 in wt and morphants), and quantitative results are shown in M. (N,N′,O,O′) Proliferation marker pHH3 from immunofluorescent image was counted in the trunk region beneath the neural tube and above yolk extension area, which is related to the regions of the main vessels and ISVs. (P) The number of mitotic cells (pHH3 cells) in control was 36.4 ± 12.4 (n = 8) and in cpn1 MO was 8 ± 2.9 (n = 6). (Q) Western blot analysis showed a reduced expression level of phosphor-histone H3 (pHH3) and another proliferation marker PCNA. β-actin and histone H3 serve as loading controls. Scale bars are 200 μm for (A–E,N,O, N′,O′) and 50 μm for (F,G,I–L). All results were performed by two independent experiments and data are represented as means ± S.D. ***Refers to p < 0.0001 and **refers to p < 0.001 by an unpaired Student’s t-test. |
| Fish: | |
|---|---|
| Knockdown Reagent: | |
| Observed In: | |
| Stage Range: | Prim-5 to Prim-15 |

