Fig. 6
- ID
- ZDB-FIG-171122-23
- Publication
- Kaucka et al., 2016 - Analysis of neural crest-derived clones reveals novel aspects of facial development
- Other Figures
- All Figure Page
- Back to All Figure Page
|
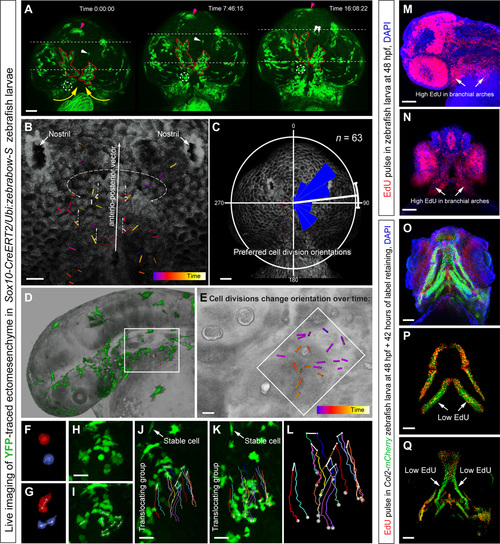
Live imaging of early zebrafish craniofacial development. (A to L) Live imaging of genetically traced neural crest–derived progenies in Sox10-CreERT2/Ubi:zebrabow-S zebrafish larvae between 30 and 56 high-power field (hpf) (A to C) and 30 and 42 hpf (D to L). (A) Ventral view on zebrafish larva head with genetically labeled groups of YFP+ cells. Note the spatial stability of translocating labeled groups during organized cell movements in the regions of expanding brachial arches and around the stomodeum. The dotted circle and white arrows show small defined trackable groups of cells. Purple arrows point at the melanocyte. The red dotted line shows how the borders of YFP+ groups change over time. Yellow arrows demonstrate the major direction of crowd movement. (B and C) Analysis of oriented cell divisions during live imaging of developing zebrafish head, ventral view. (B) Bars show orientations of individual cell divisions and color code corresponds to the timing of cell division. (C) Rose diagram of orientations of cell divisions. (D to L) Cell divisions in the branchial arch of zebrafish at 30 to 42 hpf, side view. (E) Magnified region from (D). Note that cell divisions change the predominant orientation over time. (F to L) Analysis of the group of cells from the region outlined by the white rectangle in (D). (F and G) Frames from time lapse with two dividing cells from the branchial arch. (H and I) Frame before (H) and immediately after (I) mitosis of several ectomesenchymal cells in the region, side view on the branchial arch. (J to L) Tracking of dividing ectomesenchymal cells and their progeny in the forming branchial arch. (J) First frame of tracking. (K) Final frame of tracking (12 hours). Arrows in (J) and (K) point at the stable YFP+ cell that does not change the position in the embryo and serves as a stable orientation anchor for measuring translocation/crowd movement of the labeled group of ectomesenchymal cells. Note that during the displacement of the entire group, most of the cell division products stay proximally close to each other with some rare exceptions [dark brown track in (L)]. Despite this, high intensity of local cellular mixing is achieved owing to proliferation in accordance with modeling results presented in Fig. 2 (A to C). (M and N) EdU incorporation shows proliferation rates in different parts of the developing zebrafish head. Note that a 5-min EdU pulse at 48 hpf immediately followed by the analysis showed high proliferation rates in branchial arches (arrows). (O to Q) Transgenic Col2a1aBAC:mCherry zebrafish larva’s entire head (O) and skeletal elements (P and Q) at 4 days postfertilization (dpf) with incorporated EdU, administered at 48 hpf for 5 min. Note that this EdU label–retaining experiment highlights uneven proliferation in ectomesenchymal chondrogenic progenitors at 48 hpf (5-min pulse). Arrows point at low EdU-retaining regions in the facial cartilages. Scale bars, 50 μm (A, C, M to O, and Q) and 20 μm (B, E, and H to K). |
| Gene: | |
|---|---|
| Fish: | |
| Anatomical Term: | |
| Stage Range: | Prim-15 to Long-pec |

