
Fig. S4
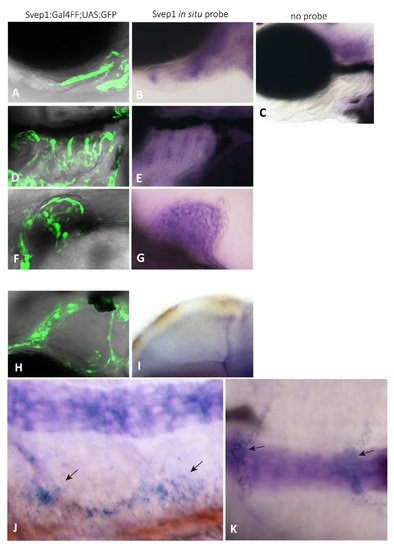
Comparison of svep1 expression domains in the svep1:GalFF; UAS:GFP transgenic line with whole mount in situ hybridization of non-transgenic embryos. Polydom/svep1 expression at 48hpf (F,G,H,I,J) and 72hpf (A,B,C,D,E) of TL fish. A,B: Higher magnification of the ceratohyal underneath the eye of a transgenic embryo (A) and upon in situ hybridization at 72hpf ; C: negative control embryo at 72hpf, lacking RNA antisense probe; D,E: svep1 is expressed in the branchial arch region at 72hpf , which can be seen in both the transgene (D) and by in situ hybridization (E); (C) serves as a negative control for (D,E) as well. F,G: svep1 expression in the fin bud at 48hpf ; H,I: svep1 expression abutting the middle cerebral vessel at 48hpf; J: Lateral view of polydom/svep1 expression in the region of the PCV at 48hpf; K: svep1 expression (indicated by the arrows) covering ISVs (compare to the transgenic expression in Figure 5B, C , main text). Notochord staining in (J,K) represents background staining and was also observed in all negative controls. Lateral views in all panels, anterior to the right. |
| Gene: | |
|---|---|
| Fish: | |
| Anatomical Terms: | |
| Stage Range: | Long-pec to Protruding-mouth |