
Fig. 2 S2
- ID
- ZDB-FIG-170103-4
- Publication
- Perens et al., 2016 - Hand2 inhibits kidney specification while promoting vein formation within the posterior mesoderm
- Other Figures
- All Figure Page
- Back to All Figure Page
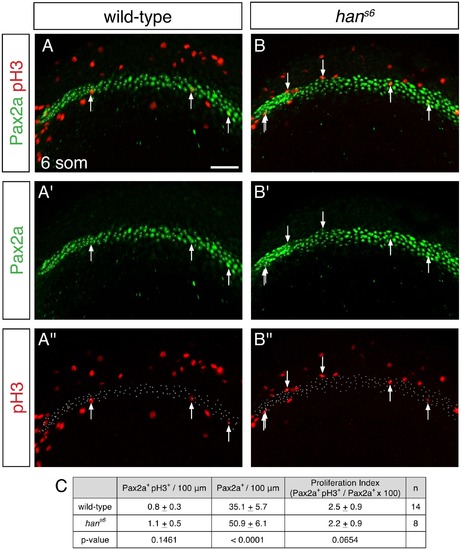
Comparable proliferation in the IM of wild-type and hans6 mutant embryos. (A, B) Immunofluorescence for Pax2a and phospho-Histone H3 (pH3) in wild-type (A) and hans6 mutant (B) embryos at the 6 somite stage; dorsal views, anterior to the left, are three-dimensional reconstructions of 400 µm long regions used for quantification of the numbers of Pax2a+ (A', B') and pH3+ (A'', B'') cells. Arrows indicate Pax2a+ pH3+ cells. Scale bar represents 50 μm. (C) Table compares the number of Pax2a+ pH3+ cells per 100 µm of IM, the number of Pax2a+ cells per 100 µm of IM, and the proliferation index (Pax2a+ pH3+ cells / Pax2a+ cells X 100) in wild-type and hans6 mutant embryos. Data shown represent the average and standard deviation for each value. While there was a statistically significant increase in the number of Pax2a+ cells in hans6 mutants compared to wild-type (p<0.0001), no significant differences were observed for the number of Pax2a+ pH3+ cells (p=0.1461) or the proliferation index (p=0.0654). |