
Fig. 6
- ID
- ZDB-FIG-161122-13
- Publication
- Pérez-Schuster et al., 2016 - Sustained Rhythmic Brain Activity Underlies Visual Motion Perception in Zebrafish
- Other Figures
- All Figure Page
- Back to All Figure Page
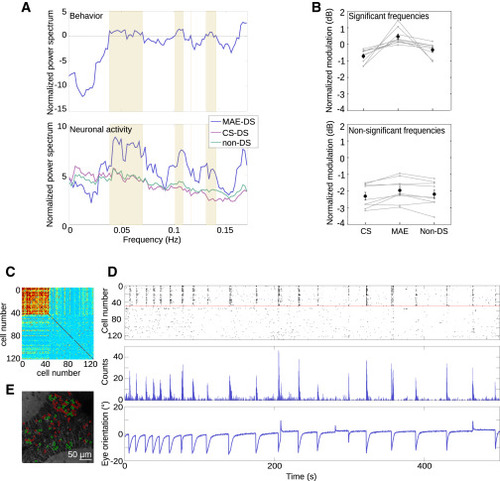
Frequency Analysis and Topography of MAE-Associated Neurons (A) Top: normalized power spectrum of eye movements during MAE-like behavior. Bottom: normalized power spectrum of neuronal data during MAE-like behavior. Violet, MAE direction-selective neurons; pink, CS direction-selective neurons; green, non-direction-selective neurons; yellow patches, significant behavioral frequencies (normalized power spectrum exceeds a threshold set at zero, dashed gray line). (B) Top: normalized averaged frequency power of behaviorally relevant significant frequencies, during post-CS control period. Gray lines, the individual experiments for the CS, MAE, and non-direction-selective neurons; black line, the mean power value. CS direction-selective modulation = −0.71 ± 0.13 dB, MAE direction-selective modulation = 0.15 ± 0.16 dB, and non-direction-selective modulation = −0.11 ± 0.14 dB (p = 4.1 × 10⁻⁵ for CS and MAE direction-selective neurons, p = 2.9 × 10⁻⁴ for non-direction-selective and MAE direction-selective neurons, p = 0.04 for CS and non-direction-selective neurons, Wilcoxon rank sum test). Bottom: as for top, but for non-significant non-behaviorally relevant frequencies. CS direction-selective modulation = −2.3 ± 0.7 dB, MAE direction-selective modulation = −1.96 ± 0.72 dB, and non-direction-selective modulation = −2.19 ± 0.75 dB (p = 0.34 for CS and MAE direction-selective neurons, p = 0.49 for non-direction-selective and MAE direction-selective neurons, p = 0.6 for CS and non-direction-selective neurons, Wilcoxon rank sum test). In both cases, error bars, SE. n = 9 trials from 8 larvae. (C) Pairwise correlation matrix of MAE direction-selective neuronal activity during the post-CS period. The matrix was ordered according to k-means clustering. The color-scale bar shows the level of correlation. (D) Top: raster plot of MAE direction-selective neurons during the post-CS control period ordered according to (A). Middle: sum of calcium activity. Bottom: eye orientation. About 30% of the neurons show synchronous Ca2+ transients associated with all eye pursuits in the MAE direction. (E) Topography of the MAE direction-selective neurons. Green, neurons correlated with the pursuits in the direction of MAE; red, non-correlated neurons. |