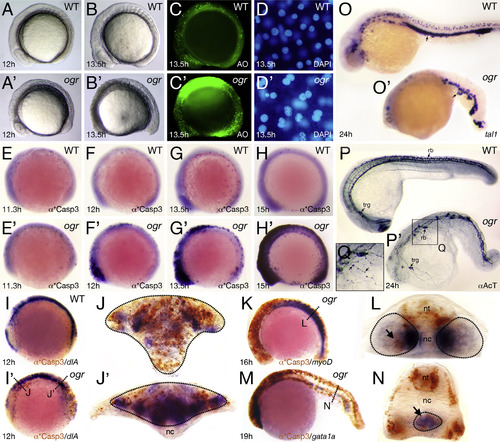
Fig. 1
|
The ogre mutant phenotype. (A and B) Live embryos; (C) after acridine orange staining to show cell death; and (D) after DAPI-squash to show nuclei. (E-H) anti-Active Caspase 3 staining showing progression of apoptosis; and with dlA expression (I) marking neural tissue in the brain and spinal cord, with myoD expression (K) marking somite muscle in the trunk, and with gata1a expression (M) marking blood in the posterior blood island. (J, L, N) Are high magnification cross-sections through the areas indicated with lines and tissues are circled while arrows indicate apoptotic cells; abbreviations: nt, neural tissue; nc, notochord. (O-Q) Expression of: (O) tal1 mRNA marking blood cells (arrows) and (P) Acetylated Tubulin marking trigeminal (trg) and Rohon-Beard sensory (rb) neurons (arrows). (Q) High magnification of mutant axons, showing abnormal varicosities (arrows). |
| Gene: | |
|---|---|
| Antibodies: | |
| Fish: | |
| Anatomical Terms: | |
| Stage Range: | 1-4 somites to Prim-5 |
| Fish: | |
|---|---|
| Observed In: | |
| Stage Range: | Sphere to Prim-5 |
Reprinted from Developmental Biology, 418(2), Warga, R.M., Wicklund, A., Richards, S.E., Kane, D.A., Progressive loss of RacGAP1/ogre activity has sequential effects on cytokinesis and zebrafish development, 307-22, Copyright (2016) with permission from Elsevier. Full text @ Dev. Biol.

