
FIGURE
Fig. 5
Fig. 5
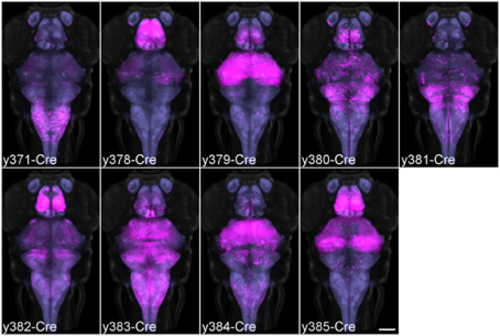
Average brain representations of Cre enhancer trap lines. Maximum projections through the 9 Cre enhancer trap lines imaged for this study. Each line was visualized using the βactin:Switch transgenic line and scanned with HuC:Cer in order to register the pattern to the database. At least three brains were scanned and averaged for each line (magenta). Background: ubiquitous βactin:Switch (gray) and pan-neuronal HuC:Cer (blue, after brain mask applied). Scale bar 100 µm. |
Expression Data
Expression Detail
Antibody Labeling
Phenotype Data
Phenotype Detail
Acknowledgments
This image is the copyrighted work of the attributed author or publisher, and
ZFIN has permission only to display this image to its users.
Additional permissions should be obtained from the applicable author or publisher of the image.
Full text @ Front. Neural Circuits