
FIGURE
Fig. S4
- ID
- ZDB-FIG-160805-7
- Publication
- Hu et al., 2016 - Transcriptome comparison reveals a genetic network regulating the lower temperature limit in fish
- Other Figures
- All Figure Page
- Back to All Figure Page
Fig. S4
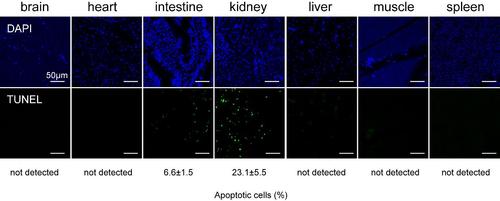
Apoptosis analysis of other 7 tissues at 8°C/12 h by TUNEL. The nucleus was counterstained with DAPI. Scale bar is 50 µm. The proportion apoptotic cells (Mean ± SD) is indicated in the below and are based on at least three biological replicates, with each replicate having at least 3 individuals. |
Expression Data
Expression Detail
Antibody Labeling
Phenotype Data
Phenotype Detail
Acknowledgments
This image is the copyrighted work of the attributed author or publisher, and
ZFIN has permission only to display this image to its users.
Additional permissions should be obtained from the applicable author or publisher of the image.
Full text @ Sci. Rep.