
Fig. 3
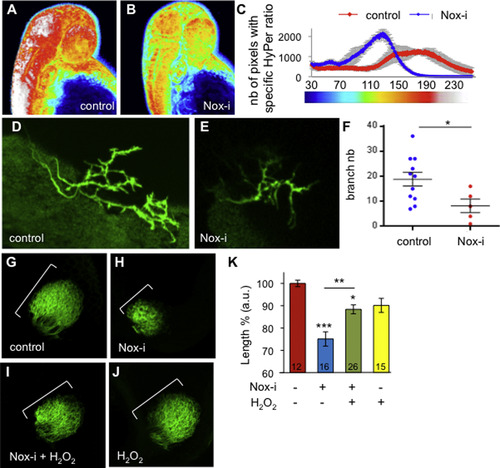
A reduction of the H2O2 levels impairs the RGC projections. (A, B) HyPer imaging at 2 dpf in the control (n=3), or Nox-i-treated larvae (n=3). (C) Number of pixels corresponding to the pseudo-colour (HyPer ratio). (D-K) RGC arborization at 3 dpf in control embryos (D, G), embryos treated with Nox-i (E, H), Nox-i+H2O2 (I) or H2O2 (J) from 2 to 3 dpf. (D, E) GFP expression in the [pou4f3:GAL4, UAS:GAP-GFP] larvae with or without Nox-i treatment. (F) Branch number per axon in this transgenic line. (G-J) DiO RGC labelling at 3 dpf. The maximum length of the projections was quantified (K). The n values are indicated at the bottom of each column of the graph. Representative images are shown. The error bars represent the standard error of the mean (SEM) (*p<0.05; ***p<0.001). |
Reprinted from Developmental Biology, 414(2), Gauron, C., Meda, F., Dupont, E., Albadri, S., Quenech'Du, N., Ipendey, E., Volovitch, M., Del Bene, F., Joliot, A., Rampon, C., Vriz, S., Hydrogen peroxide (H2O2) controls axon pathfinding during zebrafish development, 133-41, Copyright (2016) with permission from Elsevier. Full text @ Dev. Biol.