Fig. 7
- ID
- ZDB-FIG-160329-13
- Publication
- Chiu et al., 2016 - A Zebrafish Genetic Screen Identifies Neuromedin U as a Regulator of Sleep/Wake States
- Other Figures
- All Figure Page
- Back to All Figure Page
|
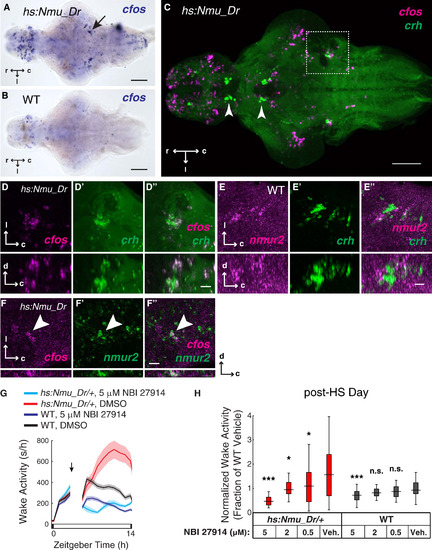
Nmu Overexpression Activates Brainstem crh Neurons and the Nmu Overexpression Locomotor Phenotype Requires Crh Receptor 1 Signaling (A and B) ISH analysis of cfos expression 1 hr after heat-shock induction of Nmu overexpression in a 5 dpf hs:Nmu_Dr/+ transgenic zebrafish brain (A) and in an identically treated non-transgenic sibling (B). Arrow indicates cfos-expressing brainstem populations. (C-D′′) Double fluorescent ISH reveals brainstem colocalization of cfos and crh expression following Nmu overexpression (dotted box is magnified in D), whereas diencephalic crh expression does not colocalize with cfos (arrowheads). The brainstem populations in (C) are presented in separate and overlaid confocal channels at higher magnification dorsal (D-D′′, top) and orthogonal (D-D′′, bottom) views to demonstrate colocalization. (E-E′′) Double fluorescent ISH reveals sparse colocalization of nmur2 and crh expression in the same brainstem populations and in the same views as shown in (D)-(D′′). (F) Following Nmu overexpression, some nmur2-expressing cells colocalize with cfos in the same brainstem populations and in the same views as shown in (E-E′′). Scale bars = 100 µm in (A)-(C) and 20 µm in (D)-(F). Images are maximum intensity projections of optical stack thickness = 300 µm (C), 82 µm (D), 85 µm (E), and 16 µm (F). (G) 5 µM NBI 27914, a Crhr1 antagonist, or vehicle (0.05% DMSO) was applied to hs:Nmu_Dr/+ larvae and their WT siblings immediately after a 1 hr heat shock at 12 p.m. Line plot indicates mean ± SEM. Number of subjects: hs:Nmu_Dr/+, 5 µM NBI 27914 (n = 40), WT, 5 µM NBI 27914 (n = 55), hs:Nmu_Dr/+, DMSO (n = 47), WT, DMSO (n = 49). (H) Additional experiments performed at 2 µM and 0.5 µM NBI 27914 reveal dose-dependent inhibition of the Nmu overexpression phenotype. Data were normalized by dividing the average post-HS day waking activity of each fish by the mean value of within-experiment WT vehicle samples. Normalized values from individual samples across separate experiments were then pooled for analysis and box plots. Number of subjects: hs:Nmu_Dr/+, NBI 27914: 5 µM (n = 40), 2 µM (n = 25), 0.5 µM (n = 35), DMSO (n = 101); WT, NBI 27914: 5 µM (n = 55), 2 µM (n = 23), 0.5 µM (n = 32), DMSO (n = 103). *p < 0.05, **p < 0.01, n.s. p > 0.05, Kruskal-Wallis test followed by the Steel-Dwass test for pairwise multiple comparisons of each drug condition against its same-genotype vehicle control. |
| Genes: | |
|---|---|
| Fish: | |
| Condition: | |
| Anatomical Terms: | |
| Stage: | Day 5 |
| Fish: | |
|---|---|
| Conditions: | |
| Observed In: | |
| Stage: | Day 5 |

