|
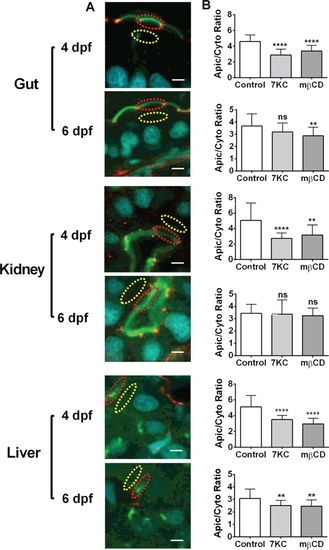
Localization of aPKC in epithelial cells in the gut, kidney and liver of sterol-manipulated zebrafish larvae. Untreated (Control), 7KC-enriched (7KC) and cholesterol depleted (mβCD) zebrafish larvae that were treated at 4 pdf or treated at 4 dpf and left to recover to 6 dpf were fixed and immuno-stained for aPKC (green) and ZO-1 (red) while nuclei were stained with DAPI (blue). From confocal images (A), the ratio of the aPKC intensity of apical (indicated by red dotted oval) and cytoplasm (indicated by yellow dotted oval) was extracted and calculated in (B). In (A), scale bar = 5 µm. In (B), data are mean and standard of 100 of ROI. ns, not significant, p > 0.05; **p < 0.01; ****p < 0.0001 relative to Control (one-way ANOVA with Bonferroni post-test).
|