
FIGURE
Fig. 5
- ID
- ZDB-FIG-151209-7
- Publication
- Yao et al., 2014 - Systematic characterization of small RNAome during zebrafish early developmental stages
- Other Figures
- All Figure Page
- Back to All Figure Page
Fig. 5
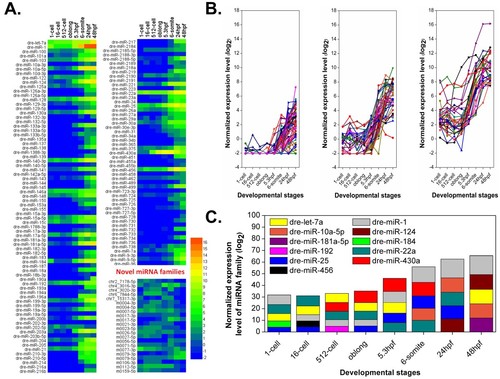
The clustering analysis of miRNA families. (A) The RPM-normalized expression profiles of known and novel miRNA families in eight developmental stages; (B) The RPM-normalized expression profiles of known miRNA families were clustered into three distinct groups with the k-means clustering algorithm in Cluster 3.0 [35]; (C) Top 5 mostly expressed miRNA families were shown for each stage. |
Expression Data
Expression Detail
Antibody Labeling
Phenotype Data
Phenotype Detail
Acknowledgments
This image is the copyrighted work of the attributed author or publisher, and
ZFIN has permission only to display this image to its users.
Additional permissions should be obtained from the applicable author or publisher of the image.
Full text @ BMC Genomics