
Fig. 4
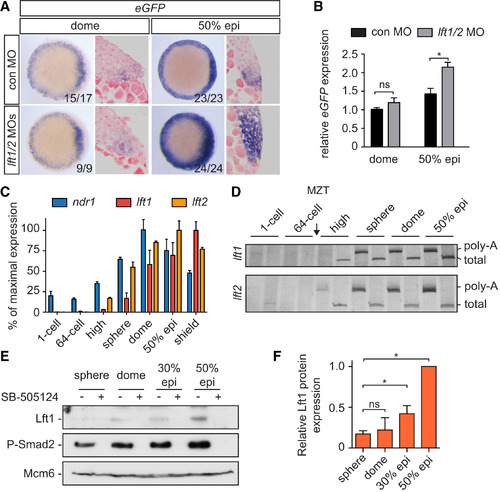
Delayed Translation of Lft1/2 Levels during Early Blastula Stages (A) WISH for eGFP in dome and 50% epiboly Tg(ARE:eGFP) embryos, injected with control or lft1/2 MOs. Animal views are shown at left, and ventrolateral sections are shown at right. (B) qPCR for eGFP mRNA on pooled dome and 50% epiboly embryos. Depicted are means ± SEM (p < 0.01, t test; n = 6). (C) qPCR for ndr1, lft1, and lft2 at different stages. The percentage of mean maximal expression ± SD from a representative experiment performed in triplicate is shown. (D) Extension poly-A test (ePAT) for lft1 and lft2 mRNA. Silver stained non-denaturing polyacrylamide gels are shown indicating total and polyadenylated (poly-A) mRNA. (E) Western blot showing protein expression of endogenous Lft1 and phosphorylated Smad2 in pooled, blastula-stage embryos. Treatment with SB-505124 is shown to confirm the Lft1 band. Mcm6 is a loading control. (F) Quantification of Lft1 protein expression from sphere to 50% epiboly. Depicted are the average band intensities of three independent blots, normalized to levels at 50% epiboly ± SD (p < 0.05, t test). See also Figure S6. |
Reprinted from Developmental Cell, 35, van Boxtel, A.L., Chesebro, J.E., Heliot, C., Ramel, M.C., Stone, R.K., Hill, C.S., A Temporal Window for Signal Activation Dictates the Dimensions of a Nodal Signaling Domain, 175-185, Copyright (2015) with permission from Elsevier. Full text @ Dev. Cell