
FIGURE
Fig. 4
- ID
- ZDB-FIG-150831-28
- Publication
- Roberto et al., 2015 - Evidence for the conservation of miR-223 in zebrafish (Danio rerio): Implications for function
- Other Figures
- All Figure Page
- Back to All Figure Page
Fig. 4
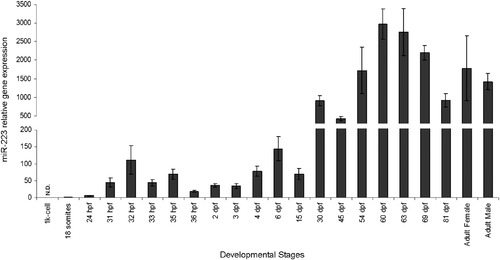
Analysis of mature miR-223 expression during zebrafish development. MiR-223 expression was determined by qPCR analysis using RNA samples from different stages of zebrafish development, and normalized to levels of zebrafish U6 small RNA. Values are the mean of at least 3 independent replicates; hpf indicates hours post-fertilization; dpf indicates days post-fertilization, N.D. indicates non-detected. Gap in the y axis separates two different scales. |
Expression Data
| Gene: | |
|---|---|
| Fish: | |
| Anatomical Term: | |
| Stage Range: | 1k-cell to Adult |
Expression Detail
Antibody Labeling
Phenotype Data
Phenotype Detail
Acknowledgments
This image is the copyrighted work of the attributed author or publisher, and
ZFIN has permission only to display this image to its users.
Additional permissions should be obtained from the applicable author or publisher of the image.
Reprinted from Gene, 566(1), Roberto, V.P., Tiago, D.M., Gautvik, K., Cancela, M.L., Evidence for the conservation of miR-223 in zebrafish (Danio rerio): Implications for function, 54-62, Copyright (2015) with permission from Elsevier. Full text @ Gene