
FIGURE
Fig. 3
- ID
- ZDB-FIG-150804-3
- Publication
- Panza et al., 2015 - Live imaging of endogenous protein dynamics in zebrafish using chromobodies
- Other Figures
- All Figure Page
- Back to All Figure Page
Fig. 3
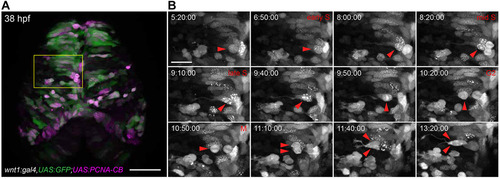
Cell cycle analysis of transgenic zebrafish embryos expressing PCNA-CB. (A) Overview of the dorsal midbrain of a wnt1:gal4,UAS:GFP (green); UAS:PCNA-CB (magenta) double transgenic embryo at 38hpf. (B) Unaltered cell cycle progression in PCNA-CB-expressing, wnt1-positive neural progenitors. PCNA-CB signal transitions from a speckled configuration (S phase) to an evenly distributed one (G2), which precedes mitosis (M). Arrowheads indicate a cell progressing through its last cycle before terminally differentiating into two daughter neurons. Time-stamps: h:min:s. Scale bars: 50µm in A; 20µm in B. |
Expression Data
Expression Detail
Antibody Labeling
Phenotype Data
Phenotype Detail
Acknowledgments
This image is the copyrighted work of the attributed author or publisher, and
ZFIN has permission only to display this image to its users.
Additional permissions should be obtained from the applicable author or publisher of the image.
Full text @ Development