
FIGURE
Fig. 5
- ID
- ZDB-FIG-150122-7
- Publication
- Zada et al., 2014 - Altered Behavioral Performance and Live Imaging of Circuit-Specific Neural Deficiencies in a Zebrafish Model for Psychomotor Retardation
- Other Figures
- All Figure Page
- Back to All Figure Page
Fig. 5
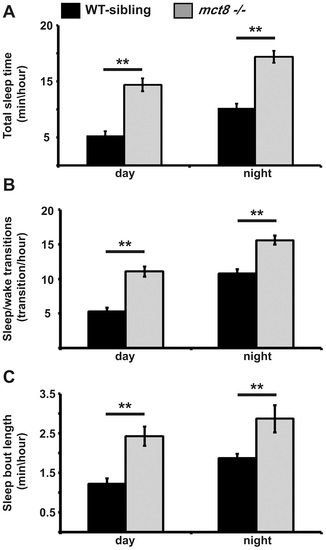
Sleep architecture of mct8-/- larvae. A-C. Recording of sleep was performed in 6 dpf mct8-/- and WT-sibling larvae during 24 h under a 14 h light/10 h dark cycle. Total sleep time (A), the number of sleep/wake transitions (B) and sleep-bout length (C) monitored in mct8-/- and WT-sibling larvae. Values are represented as means±SEM (standard error of the mean). Statistical significance was determined by t-test: two-sample assuming unequal variances (** p<0.001). |
Expression Data
Expression Detail
Antibody Labeling
Phenotype Data
| Fish: | |
|---|---|
| Observed In: | |
| Stage: | Day 6 |
Phenotype Detail
Acknowledgments
This image is the copyrighted work of the attributed author or publisher, and
ZFIN has permission only to display this image to its users.
Additional permissions should be obtained from the applicable author or publisher of the image.
Full text @ PLoS Genet.