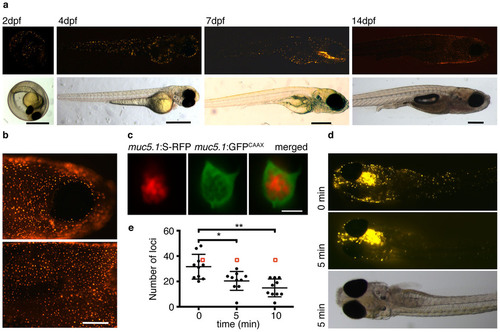
(a) –Visualization of embryos at 2, 4, 7 and 14 days post fertilization (dpf) by fluorescence (top row) and bright field (bottom row) microscopy shows that the mucin reporter expresses in distinct loci distributed across the skin of the fish. Scale bars are 0.5 mm. (b) –Live visualization of the fluorescent mucin reporter in the head (top) and trunk (bottom) of 14 dpf fish. Scale bar is 200 μm. (c) – Confocal image of a muc5.1:S-RFP-positive locus shows that the mucin reporter is packed inside secretory vesicles in cells within the skin. The cell membranes are labeled with GFP that was expressed under the promoter of muc5.1 and targeted to the membrane via a CAAX motif. Scale bar is 5 μm. (d) – Exposure of fish to LPS results in the partial loss of muc5.1:S-RFP loci and a simultaneous appearance of fluorescence in the immediate surrounding of the fish, suggesting the secretion of the mucin reporter. The bright field image (bottom) shows that fish remain intact during this treatment. (e) – Quantification of fluorescent loci within a consistent region (approximately between the head and top of the trunk) in ten individual fish before and after exposure to LPS. The red square is the mean of 10 control fish (no LPS addition) at t = 0, 5, and 10 minutes. The mean value is 35.7 across all three time points. For the LPS addition, each point represents the number of fluorescent loci in the same fish at the various time points (10 fish total). The error bars indicate standard deviation. One * indicates p < 0.05 between 0 minutes and 5 minutes using paired two-tailed T-test. Two ** indicates p < 0.01 using the same test between 0 minutes and 10 minutes. In most fish, a substantial proportion of loci are lost on treatment with LPS, suggesting that the mucin-reporter is secreted on this stimulus.
|

