
Fig. 3
- ID
- ZDB-FIG-140325-35
- Publication
- Priyadarshini et al., 2013 - Oxidative stress and regulation of Pink1 in zebrafish (Danio rerio)
- Other Figures
- All Figure Page
- Back to All Figure Page
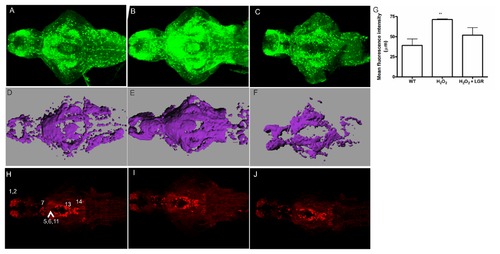
The effect of H2O2 on GFP and TH1 expression in Tg(pink1:EGFP) larval fish. A-C. GFP-ir at 7 dpf in the zebrafish larvae. GFP-ir increases in the H2O2-treated fish (B) as compared to the control fish (A). The effect is rescued in the LGR treated fish (C). D. Mean fluorescence intensity values of the WT, H2O2-treated group and the H2O2+LGR treated group. A significant change in the H2O2-treated group was observed (p < 0.01). E-G. A three-dimensional image to perform volume rendering was constructed using the Imaris MeasurementPro module in Imaris software for the above-mentioned fish at a similar threshold intensity. The changes indicated as the changed total volume of the representative images for control (E), H2O2 (F) and LGR-treated fish (G). Scale bar represents 80 μm. H-J. TH-ir is unchanged among the control (H), H2O2-treated (I) and H2O2 together with LGR (J) groups of larval fish. No change in the pretectal (7) and preoptic, thalamic or pre-tectal nucleus (5,6,11) cell populations was seen. Other visible groups in the olfactory bulb and ventral telencephalic nuclei (1,2), periventricular hypothalamus and posterior tuberculum (13), and the locus coeruleus (14) also displayed no change in TH-ir. Scale bar represents 100 μm. A-C and H-J. H2O2 – Hydrogen Peroxide, GFP – Green fluorescent protein, ir – immunoreactivity, LGR – L-glutathione reduced, PINK1 – PTEN-induced putative kinase 1, TH – tyrosine hydroxylase. |
| Gene: | |
|---|---|
| Fish: | |
| Condition: | |
| Anatomical Terms: | |
| Stage: | Days 7-13 |