|
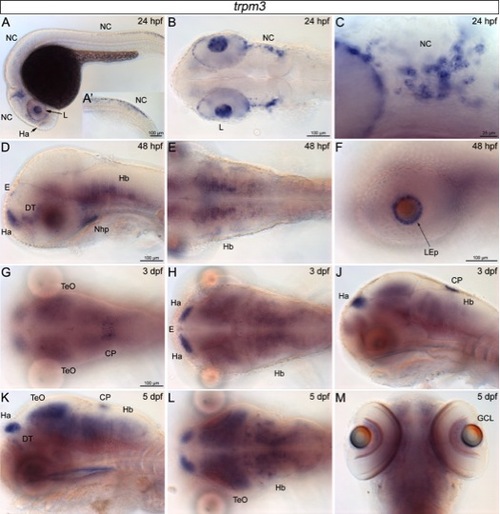
Expression of trpm3 in whole-mount zebrafish during embryonic and larval stages. A–C: Lateral (A, A′,C) and dorsal (B) views of embryos 24 hours post fertilization (hpf) with (A′) showing staining in NC cells of the tail and (C) providing a higher magnification of trpm3 expression in cranial NC cells. D–F: Lateral (D, F) and dorsal (E) views of embryos staged 48 hpf. G–J: The 3 days post fertilization (dpf) larvae shown from the dorsal (G,H) and lateral (J) side, respectively. K–M: Lateral (K), dorsal (L), and ventral (M) views of larvae staged 5 dpf. Zebrafish are orientated with anterior to the left in all pictures but M, where anterior is to the top. Scale bars of 100 μm are indicated in the first picture of a series until changed. Scale bar in C refers to 25 μm. NC, neural crest; Ha, habenula; E, epiphysis; DT, dorsal thalamus; Nhp, neurohypophysis; Hb, hindbrain; LEp, lens epithelium; TeO, optic tectum; CP, choroid plexus; GCL, ganglion cell layer.
|