
FIGURE
Fig. 4
- ID
- ZDB-FIG-130117-36
- Publication
- Sousa et al., 2012 - A new zebrafish bone crush injury model
- Other Figures
- All Figure Page
- Back to All Figure Page
Fig. 4
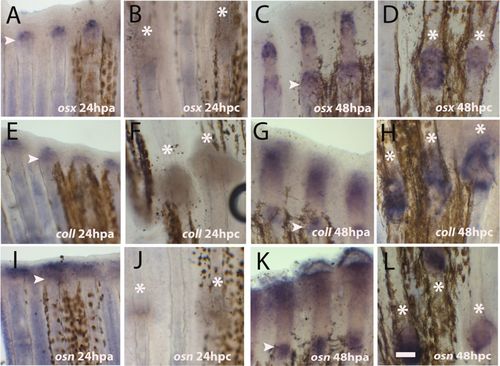
Expression of skeletogenesis genes after crush injury. (A–L) Whole mount in situ hybridization for mRNA detection of (A–D) osterix at (A) 24hpa; (B) 24hpc (C) 48hpa (D) 48hpc; (E–H) collagen I at (E) 24hpa (F) 24dpc (G) 48hpa (H) 48hpc; (I–L) osteonectin at (I) 24hpa (J) 24hpc (K) 48hpa (L) 48hpc. Arrowheads indicate the amputation plane and asterisks indicate crush injury sites. Scale bar corresponds to 100μm in all panels. (hpa – hours post-amputation; hpc – hours post-crush injury). |
Expression Data
Expression Detail
Antibody Labeling
Phenotype Data
Phenotype Detail
Acknowledgments
This image is the copyrighted work of the attributed author or publisher, and
ZFIN has permission only to display this image to its users.
Additional permissions should be obtained from the applicable author or publisher of the image.
Full text @ Biol. Open