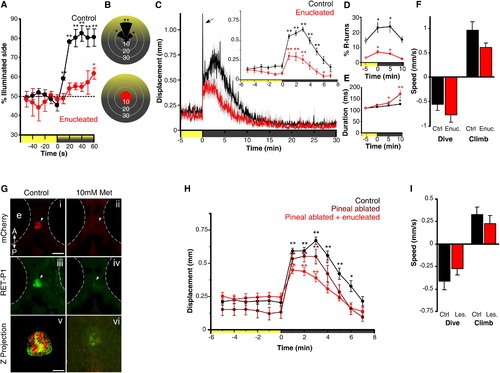
Light-Driven Behavior in Larval Zebrafish without Eyes or Pineal(A) Attraction of control and enucleated larvae to a phototaxis stimulus, measured by the percent of larvae observed on the illuminated side of the testing arena over time. Enucleated larvae exhibit a gradual shift to the illuminated side of the arena (symbols show one-sample t test to 50%; n = 4 groups of 15 larvae). Larval positions were recorded every second and then averaged over 10 s for each time point. Color along x axis indicates light condition.(B) Larval body orientation during exposure to a phototaxis stimulus. A significant proportion of control larvae exhibit a “head-on” orientation toward the spotlight (one-way ANOVA; F7, 24 = 51.21, p < 0.001; comparisons are Tukey’s post hoc), whereas enucleated larvae show no bias in body orientation (ANOVA; F7, 24 = 1.73, p = 0.15; n = 4 groups of 15 larvae). Data represent mean proportion of larvae oriented relative to the target light over 1 min.(C) Locomotor activity during dark-induced VMR. Arrow indicates O-bend spike observed only in controls. Inset: enucleated larvae significantly increase activity following light extinction (repeated-measures ANOVA; F2.5, 88.7 = 16.57, p < 0.001; n = 36 larvae). Data represent the mean activity for the preceding minute. Color along x axis indicates light condition. Pairwise comparisons are to the baseline time point at 5 min.(D and E) Kinematic analysis of VMR. Enucleated larvae (red) retain elevated R-turn initiation frequency (D; repeated-measures ANOVA; F2.1, 56.6 = 4.63, p = 0.013) and swim bout duration (E; repeated-measures ANOVA; F3, 40 = 6.41, p = 0.001) as seen in controls. Data represent the mean of observations during the first 16 s following each time point. Pairwise comparisons are to the baseline measurement at 5 min (empty circles) (control: n = 18 groups of 10 larvae; enucleated: n = 28 groups of 10 larvae).(F) Diving and climbing speed during VMR. In either response, enucleated larvae were not significantly different from controls (dive: t test, p = 0.27; climb: t test, p = 0.07; n = 6 groups of 5 larvae). Additionally, speed in all conditions is significantly different from 0 (one-sample t test, p < 0.005). Data represent mean vertical swim speed over the first 20 s of dive and ascent.(G) Nitroreductase-mediated ablation of the pineal. Dorsal views at 6 days postfertilization (dpf) are shown. (i–iv) Epifluorescence images of the pineal (arrow) in untreated and metronidazole (Met)-treated Tg(tph2:NfsB-mCherry)y227 larvae with anti-mCherry (red; i and ii) and anti-RET-P1 (green; iii and iv). Scale bar represents 100 μm. (v and vi) Confocal z projections (mCherry + RET-P1) showing concurrent nitroreductase and opsin expression in the pineal in untreated (v) and Met-treated (vi) larvae. Scale bar represents 25 μm.(H) VMR in enucleated, pineal-ablated larvae. Both pineal-ablated and pineal-ablated + enucleated larvae show a robust VMR following light extinction (repeated-measures ANOVA; F3.8,131.3 = 32.44, p < 0.001) (control and pineal-ablated + enucleated: n = 36 larvae; pineal-ablated: n = 26 larvae). Data represent mean activity for the preceding minute. Pairwise comparisons are to baseline time point 5 min.(I) Diving and climbing speed of enucleated, pineal-ablated larvae during VMR. In either response, lesioned larvae were not significantly different from controls (t test; dive: p = 0.26; climb: p = 0.42). Mean speed of dive and ascent for both groups is significantly different from zero (one-sample t test, p < 0.005; n = 14 groups of 5 larvae). Data represent mean swim speed over the first 20 s of dive and ascent.For all panels, error bars show SEM; p < 0.05, p < 0.01. See also Figure S1.
|
