
Fig. 6
- ID
- ZDB-FIG-111115-6
- Publication
- Lister et al., 2011 - Embryonic expression of zebrafish MiT family genes tfe3b, tfeb, and tfec
- Other Figures
- All Figure Page
- Back to All Figure Page
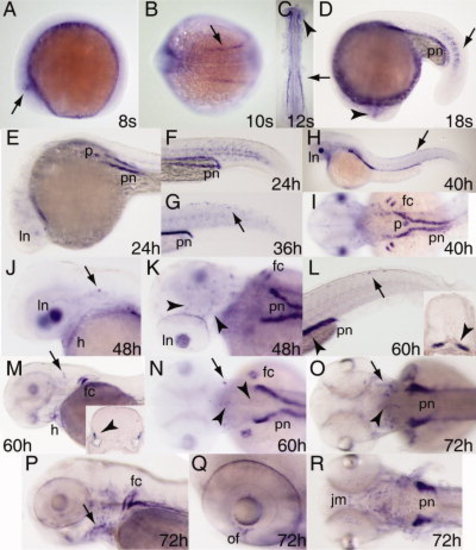
Expression pattern of tfeb during embryogenesis. Whole mount RNA in situ hybridization was performed on embryos at the stages indicated. Expression is first observed in the eye (arrowheads in A,C,D), and shortly thereafter in the paraxial and lateral plate mesoderm (arrows in B–D). Lens expression increases between 24 and 48 hpf (E,J) and diminishes thereafter. tfeb expression is observed in the pronephros along most of its length from 18 somites (D, shown in transverse section in inset L, arrowhead) up to 72 hpf when it is concentrated in the proximal convoluted tubules (O,R). Expression in the presumptive pancreas is seen at 24 hpf (E) and 40 hpf (I) but declines thereafter (K,N). tfeb is expressed in cells along the dorsal midline (arrows in H,L), scattered cells associated with the otic capsule (arrows in J,M–O; inset in M shows transverse section through otic capsule, arrowhead indicates expressing cells) cells in the brain (arrowheads in K,N,O) and associated with the pharyngeal arches (arrow, P). Expression is also seen at 72 hpf in the optic fissure (of, Q) and jaw musculature (jm, R). A,D–H,J,L,M,P,Q, lateral views; B,I,N,O, dorsal views; K, dorsolateral view; R, ventral view. pn, pronephros; ln, lens; p, pancreas; fc, fin cartilage; h, heart. |
| Gene: | |
|---|---|
| Fish: | |
| Anatomical Terms: | |
| Stage Range: | 5-9 somites to Protruding-mouth |