Fig. 5
- ID
- ZDB-FIG-110811-37
- Publication
- Andersen et al., 2011 - In vivo imaging of cell behaviors and F-actin reveals LIM-HD transcription factor regulation of peripheral versus central sensory axon development
- Other Figures
- All Figure Page
- Back to All Figure Page
|
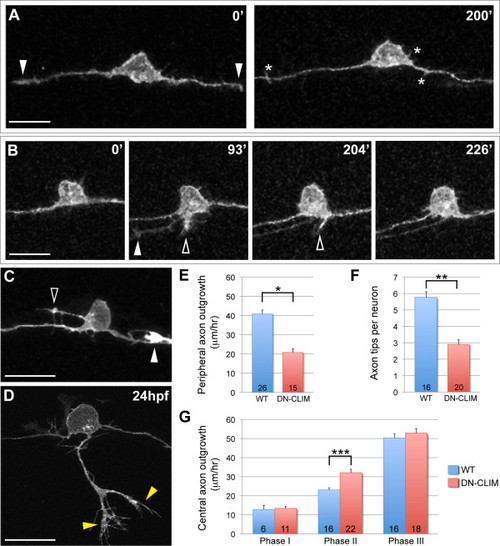
Effects of LIM-HD disruption on RB axon development. (A-D) Individual neurons labeled by transient mosaic expression of TagRFP-CAAX in DN-CLIM-expressing embryos. Dorsal-lateral views, anterior is left. Images are confocal projections. (A) Two images from a time-lapse in a DN-CLIM embryo. Arrowheads indicate central growth cones at 0′. No peripheral axons initiate. Transient filopodia form off cell body and axon shafts (asterisks). See Additional file 4 for movie. (B) Time-lapse in a DN-CLIM-expressing embryo. A peripheral axon initiates, but fails to extend. Transient neurites form in two locations (open arrowheads) and subsequently retract. Arrowhead at 93′ indicates growth cone of neighboring central axon growing through the field of view. (C) Ectopic neurite formation in a DN-CLIM-expressing embryo. A long filopodial protrusion extends from an ectopic apical location on the cell body (open arrowhead). The arrowhead indicates the growth cone of neighboring central axon that enters the field of view. (D) Example of a peripheral axon in a 24-hpf DN-CLIM-expressing embryo. The axon is shorter and less branched than the wild type (compare to Figure 2D; horizontal myoseptum in Figure 5D is out of frame). Yellow arrowheads indicate branches. See Additional file 5 for movie. (A-D) Time displayed in minutes. Scale bars = 25 μm. (E) Quantification of average central axon extension rates in wild-type (WT) versus DN-CLIM-expressing embryos. Central axon extension rates are significantly faster in DN-CLIM embryos during phase II. (F,G) Quantifications of average peripheral axon extension rates (F) and average number of branches per peripheral axon (G) in wild-type versus DN-CLIM-expressing embryos. *P < 10-7, **P < 10-6, and ***P = 0.0004 (two-tailed t-test). Error bars represent standard error of the mean. Numbers in bars signify number of neurons. |

