|
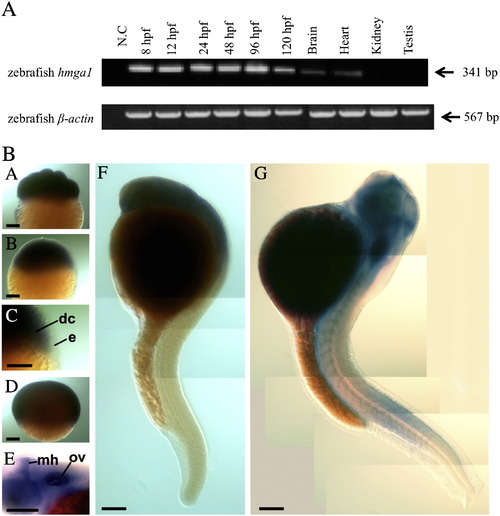
A) RT-PCR of hmga1 at different developmental stages. B) Whole mount in situ analysis of hmga1 transcription during embryogenesis. Maternally-contributed transcripts of hmga1 can be detected in early cleavage embryos (A, 8-cell stage). At 40% epiboly stage, (B, and enlargement of margin in C) transcripts are observed in deep cells (dc) but not in the enveloping cell layer (e). A similar pattern of expression is observed at 75% epiboly (D). At 24 hpf expression is restricted to mainly rostral neural tissues (F, lateral view). This pattern is continued at 48 hpf (G, lateral view) with relatively high expression in the otic vesicle (ov) and the region of the midbrain–hindbrain boundary (mh) that develops into the cerebellum (see dorso-lateral view in E of the head of the embryo in G. Rostral is to the left). Size bars indicate 100 μm. In all images dorsal or animal pole is up except in F and G where dorsal is to the right and rostral is up.
|

