
FIGURE
Fig. S6
- ID
- ZDB-FIG-110407-21
- Publication
- Kim et al., 2011 - Zebrafish model of tuberous sclerosis complex reveals cell-autonomous and non-cell-autonomous functions of mutant tuberin
- Other Figures
- All Figure Page
- Back to All Figure Page
Fig. S6
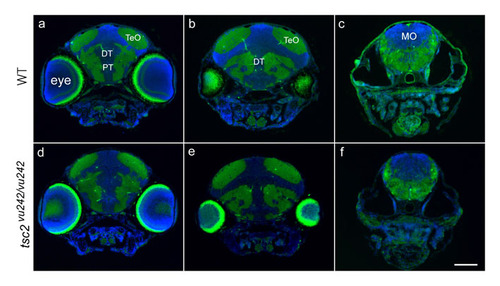
Normal posterior brain morphology in tsc2vθ242/vθ242 mutant zebrafish. Coronal sections through the posterior diencephalon to hindbrain of wild-type embryos (A-C) and tsc2vu242/vu242 mutant embryos (D-F) at 7.5 dpf. Blue staining (DAPI) marks cell nuclei, green is autofluorescence from white matter. TeO, tectum opticum; DT, dorsal thalamus; PT, posterior tuberculum; MO, medulla oblongata. Scale bar equals 100 μm. |
Expression Data
Expression Detail
Antibody Labeling
Phenotype Data
Phenotype Detail
Acknowledgments
This image is the copyrighted work of the attributed author or publisher, and
ZFIN has permission only to display this image to its users.
Additional permissions should be obtained from the applicable author or publisher of the image.
Full text @ Dis. Model. Mech.