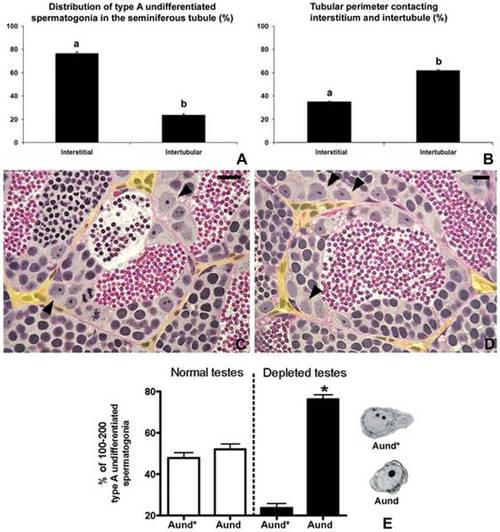
Fig. 1
|
Topographical distribution of type A undifferentiated spermatogonia in zebrafish testes. A. Quantification of type A undifferentiated spermatogonia as located near the interstitium or in the intertubular area. Note that ~76% of type A undifferentiated spermatogonia are preferentially located near the interstitium. B. Tubular perimeter of the regions contacting the interstitium or intertubular areas. A,B. Bars represent the mean ± SE which are expressed as percentage. Different letters mean significant differences among the groups. C,D. Histological sections of the zebrafish seminiferous tubules. Note that most of type A undifferentiated spermatogonia (arrowheads) are distributed near the (yellow) interstitium. Staining: PAS (Periodic Acid Schiff)/Ferric Hematoxylin/Metanil Yellow. Scale bar = 10 μm. E. Relative number of type Aund* and Aund in normal (n = 7) and busulfan-depleted testes (n = 10). Bars represent the percentage mean ± SE of 100–200 type A spermatogonia, significant differences among the groups (p<0.05) are indicated by an asterisk. |

