Fig. 2
- ID
- ZDB-FIG-101012-12
- Publication
- Mo et al., 2010 - Quantification of vestibular-induced eye movements in zebrafish larvae
- Other Figures
- All Figure Page
- Back to All Figure Page
|
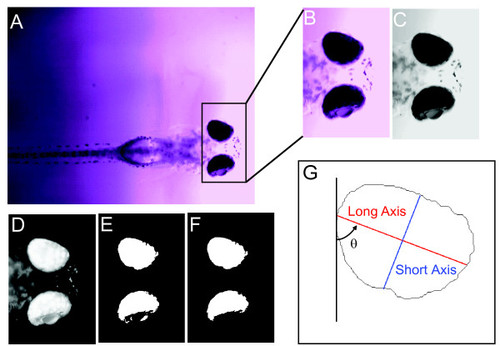
Defining the eye regions in fish larvae. Six steps (A-G) were programmed in MATLAB to quantify eye movements/eye changes in the videos. A head region image (B) was first outlined and extracted from the original image frame (A). The head region was converted into a grayscale image (C) with inverted color (D). Then, the inverted grayscale image was converted into a black-white image (E) using an arbitrary threshold. This black-white image was simplified by removing extra punctae around the retina to define the eye more clearly (F). The final step was to calculate the parameters used to quantify changes during eye movements. (G) Features calculated from the extracted eye region. θ designates the rotation angle. The red line indicates the long axis, and the blue line the short axis of the eye. |

