
FIGURE
Fig. 2
Fig. 2
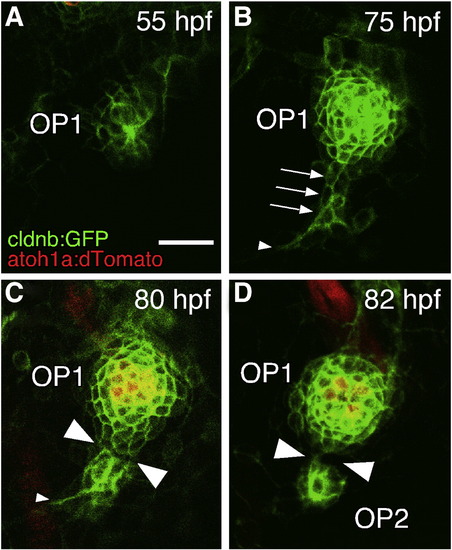
OP1 gives rise to OP2 by a budding process. (A–D) Confocal images of embryos doubly transgenic for cldnb:gfp and atoh1a:dtomato. The stages of the embryos are indicated in each panel, but the time of OP2 formation varied considerably among individuals (see text). Arrows indicate the budding structure; small arrowheads indicate leading processes; large arrowheads indicate the cleavage site. Lateral views; anterior is to the left. Scale bar: 20 μm. |
Expression Data
| Genes: | |
|---|---|
| Fish: | |
| Anatomical Terms: | |
| Stage Range: | Long-pec to Protruding-mouth |
Expression Detail
Antibody Labeling
Phenotype Data
Phenotype Detail
Acknowledgments
This image is the copyrighted work of the attributed author or publisher, and
ZFIN has permission only to display this image to its users.
Additional permissions should be obtained from the applicable author or publisher of the image.
Reprinted from Developmental Biology, 340(2), Wada, H., Ghysen, A., Satou, C., Higashijima, S.I., Kawakami, K., Hamaguchi, S., and Sakaizumi, M., Dermal morphogenesis controls lateral line patterning during postembryonic development of teleost fish, 583-594, Copyright (2010) with permission from Elsevier. Full text @ Dev. Biol.