|
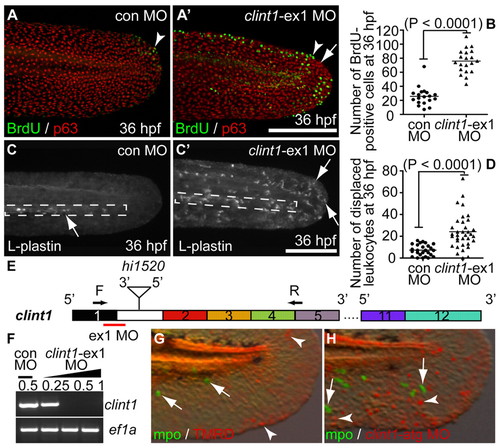
clint1 MOs phenocopy hi1520 mutant phenotypes. (A,A′,C,C′) Zebrafish embryos immunolabeled at 36 hpf for BrdU incorporation (green) and p63 (red) (A,A′) or L-plastin (C,C′) following injection of control or clint1-ex1 MO into wild-type embryos. Arrowheads identify proliferative epidermal cells. Arrows identify epidermal aggregation (A′) and leukocytes (C,C′). Boxed region, CHT. (B,D) Quantification of proliferation (B) and leukocyte displacement (D) in control (circles) and clint1-ex1 MO-injected embryos (triangles). Bar represents the mean. (E) clint1 exon structure and primers used to investigate alternative splicing. (F) RT-PCR amplification of clint1 and ef1a from control and clint1-ex1 MO-injected wild-type embryos. (G,H) Embryos immunolabeled at 48 hpf for Mpo (green, arrows) following asymmetric injection of TMRD (G, arrowheads) or clint1-atg MO with TMRD (H, arrowheads) into single cells at the 8- to 32-cell stage. Scale bars: 200 μm.
|