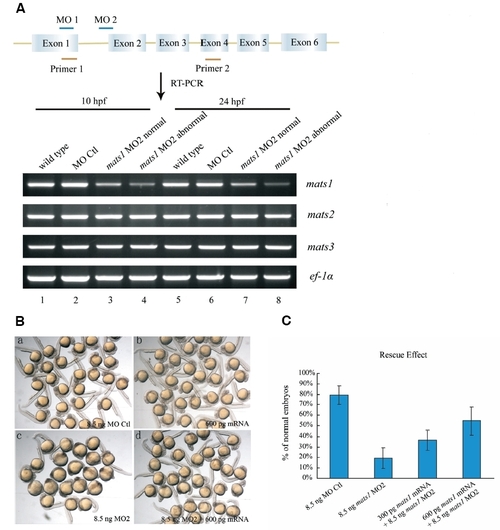
Expression of mats1 is reduced by morpholino treatment. (A) Location of mats1 MOs and effect of mats1 MO2 on mats1 mRNA levels. The schematic structure of mats1 gene is shown, and the size is not in scale. mats1 MO1 binds to ATG site and mats1 MO2 binds to the intron1-exon2 boundary. RT-PCR was done with primers 1 and 2 to detect mats1 mRNA levels at 10 hpf and 24 hpf. mats1 MO2 morphants showing abnormal phenotype and normal phenotype were grouped separately. Expression of mats1 was reduced in mats1 MO2 morphants (lane 3-4 and lane 7-8) compared to wild-type (lane 1 and 5) and MO Ctl morphant (lane 2 and 6) embryos. Degree of the reduction was positively associated with severity of abnormal phenotype. As controls, mRNA levels of mats2 and mats3 were not affected. ef-1α was used as an internal control. (B) Rescue of mats1 MO2-induced developmental delay phenotype by mats1 mRNA. (a) Embryos injected with 8.5 ng MO Ctl as a control. (b) Embryos injected with 600 pg mats1 mRNA exhibited normal phenotype. (c) Embryos injected with 8.5 ng mats1 MO2 showed severe developmental delay. (d) Most embryos co-injected with 600 pg mats1 mRNA and 8.5 ng mats1 MO2 showed normal or less severe abnormal phenotype. (C) Rescue of mats1 morphants by mats1 mRNA is dosage-dependent. At 24 hpf, only 19% (n=181) of the mats1 MO2 morphant embryos were normal. However, co-injection of 300 pg mats1 mRNA with mats1 MO2 made 37% (n=142) of the embryos to become normal. When 600 pg mats1 mRNA was coinjected, 55% (n=196) of the embryos showed a normal phenotype. Although many remaining embryos still exhibited a developmental delay phenotype, the severity was decreased. Embryos injected with 8.5 ng MO Ctl were used as a control (n=134). All the statistical data included dead embryos. All the living embryos injected with 8.5 ng MO Ctl were normal. Standard errors were shown by the error bars.
|

