Fig. 7
|
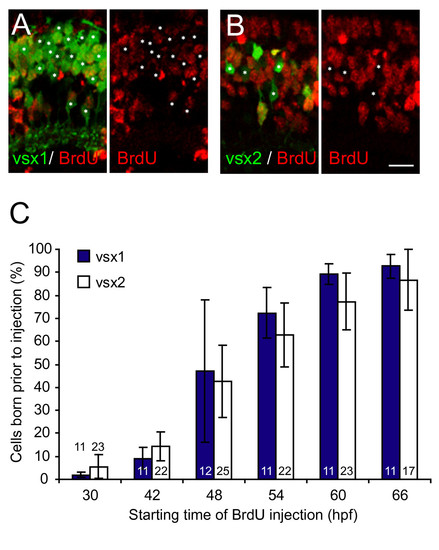
Vsx1 and Vsx2 bipolar subtypes are born at the same time. Quantification of cumulative bipolar birthdates in bromodeoxyuridine (BrdU)-injected Tg(vsx1:GFP) and Tg(vsx2:GFP) retinas. (A, B) Micrographs of central sections of retina through 75 hours post-fertilization (hpf) transgenic zebrafish showing Vsx1:GFP (A) or Vsx2:GFP (B) expression and BrdU immunohistochemistry. Prior to BrdU injection at 42 hpf, about a third of Vsx1:GFP- and Vsx2:GFP-positive cells in this central region of the retina underwent terminal division and are, therefore, BrdU immunonegative (asterisks). (C) Percentage of GFP-positive cells from Tg(vsx1:GFP) or Tg(vsx2:GFP) at 75 hpf that were born prior to the onset of BrdU injections. The temporal birth pattern of Vsx1:GFP cells and Vsx2:GFP cells is the same. Most of the vsx1 and vsx2 GFP-positive cells are born between 42 and 60 hpf. Numbers in bars indicate number of sections analysed. For Vsx1:GFP, the total number of cells included for each time point ranged from 1,209 to 1,864; for Vsx2:GFP, the total number of cells included ranged from 820 to 1,226. Note that the measurements in this graph include the entire retina (that is the central retina shown in (A, B) and the more peripheral regions where cells are born later), leading to a lower percentage in the graph than shown in the micrographs in (A, B), which are taken of the central section. Error bars show standard deviations. Scale bar: 10 μm. |

