
Fig. 1
- ID
- ZDB-FIG-090106-8
- Publication
- Jiang et al., 2008 - Exdpf is a key regulator of exocrine pancreas development controlled by retinoic acid and ptf1a in zebrafish
- Other Figures
- All Figure Page
- Back to All Figure Page
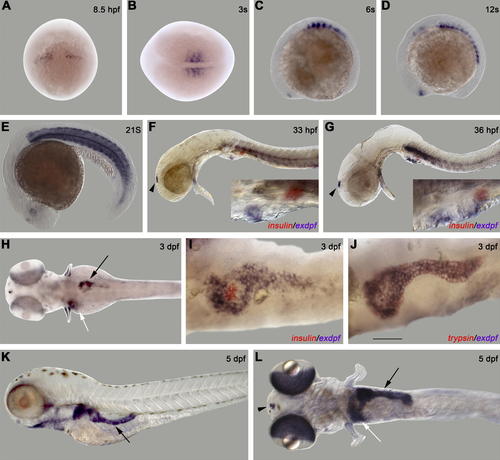
Spatiotemporal Expression of exdpf during Zebrafish Embryogenesis (A–L) In situ hybridization using an exdpf probe or an exdpf probe in combination with an preproinsulin probe (F, G and I) or a trypsin probe (J). (A) 8.5 hpf, dorsal view with anterior on the top. (B) 3-somite, dorsal view with anterior to the left. (C-G) Lateral view with anterior to the left. (C) 6-somite. (D) 12-somite. (E) 21-somite. Note strong expression in muscle area. (F) 33 hpf. (G) 36 hpf. In (F and G): Black arrowhead: epiphysis. Blue: exdpf probe; Red: preproinsulin probe. Inset: enlargement of pancreatic area. (H-J) Dorsal view with anterior to the left. (H) 3 dpf. Black arrow: pancreas. White arrow: liver. (I) 3 dpf. Double in situ hybridization using an exdpf probe (purple) and an preproinsulin probe (red). Note exdpf positive cells encircle preproinsulin-expressing cells; but exdpf is not expressed in those cells. (J) 3 dpf. Double in situ hybridization using an exdpf probe (blue) and a trypsin probe (red). Note that exdpf and trypsin perfectly overlap. (K, L) 5 dpf. (K) Lateral view with anterior to the left. Black arrow: pancreas. (L) Dorsal view with anterior to the left. Black arrow: pancreas. White arrow: liver. Black arrowhead: epiphysis. Scale bar for (I, J): 50 μm. |
| Genes: | |
|---|---|
| Fish: | |
| Anatomical Terms: | |
| Stage Range: | 75%-epiboly to Day 5 |