Fig. S2
- ID
- ZDB-FIG-080507-18
- Publication
- Ebert et al., 2008 - The calcium channel beta2 (CACNB2) subunit repertoire in teleosts
- Other Figures
- All Figure Page
- Back to All Figure Page
|
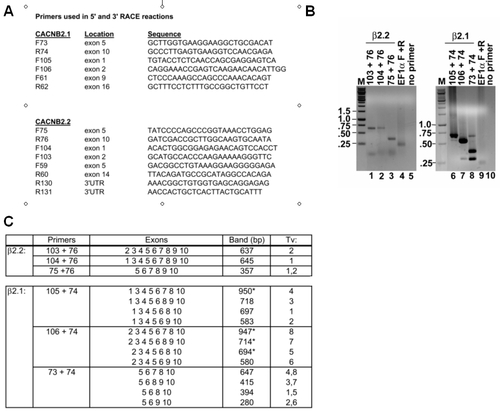
RT-PCR analysis and list of primers. (A) A list of primers used for RT-PCR analysis, and their locations (see also Figure 1 for primer locations). (B) A representative RT-PCR analysis of Danio rerio β2.1 and β2.2 transcripts. In lanes 1–3, a single band of the expected sizes amplified for β2.2, consistent with a lack of alternative splicing in the HOOK domain (spanning exons 5–8 in β2.2). In lanes 6 and 7, products consistent with β2.1_tv1 (697 bp) or β2.1_tv6 (580 bp) tended to amplify robustly. Potentially, larger amplicons from less abundant transcript variants may be out-competed in these reactions. We therefore tested primers closely flanking the HOOK domain (spanning exons 5–10 in β2.1). In lane 8, products consistent with all HOOK domain transcript variants were observed (a 647 bp band, a 415/394 bp doublet band, and a 280 bp band). Cloning and sequencing of these products of Lane 8 confirmed that the bands represented are the transcripts indicated. Lanes 4 and 9 are positive controls using primers to the house-keeping gene EF1α (220 bp). Lanes 5 and 10 are negative controls. Reactions were run on two gels, as shown (some lanes have been removed). (C) For each primer pair, the expected sizes of PCR amplicons and the exons that comprise them are listed. |

