Fig. 1
- ID
- ZDB-FIG-071019-50
- Publication
- Shang et al., 2007 - The circadian system is a target and modulator of prenatal cocaine effects
- Other Figures
- All Figure Page
- Back to All Figure Page
|
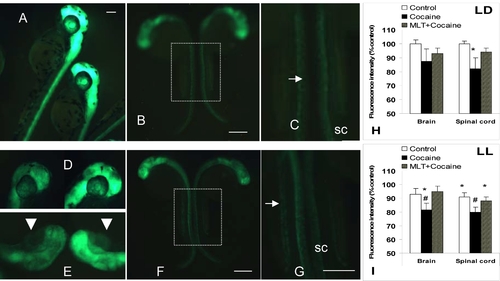
Prenatal exposure to cocaine alters neuronal development in α1-TGFP transgenic zebrafish embryos. Control embryos (A: 63 hpf; B and C: 37 hpf) show highly similar patterns of GFP reporter expression. Although major anatomical abnormalities were not found in cocaine-treated embryos, they display variable patterns and typically lower levels of GFP reporter expression (D–G) following repeated cocaine administration (1 μM, 15 min every hour for 5 daytime hours, starting at 22–24 hpf). (C) and (G) correspond to the dotted line areas in (B) and (F), respectively, and show GFP reporter expression in the spinal cord (sc) and enteric neurons (arrows). Note that a double string of enteric neurons, separated by a prospective lumen, is visible in both control embryos (c) but only in one of the cocaine-treated embryos (left in F and G). (D) and (E) depict different GFP expression patterns in the forebrain of four cocaine-treated embryos (37 hpf): lateral (D) and semi-dorsal view (e; arrowheads-eyes). All pictures are original photographs of live, responsive-to-touch embryos of the same clutch, placed next to each other on the cover glass. Black spots in (A) and (D) represent pigment. Out-of-focus areas on the close-up whole-embryo pictures (e.g., B, F) are due to the curved position of the embryo around the spherical yolk sack. The pictures are from one of the 12 clutches studied in LD, and are representative of 3 independent experiments. Scale bars: 250 μm. (H and I) Mean (SEM) percent change in fluorescence intensity in the brain and spinal cord of 37 hpf embryos raised in LD (H) or LL (I) conditions, relative to mean Control group intensity in LD (100%). Control (white bar), repeated cocaine (1 μM) administration alone (black bar) or with 30-min melatonin pre-treatment (diagonal bar) at 22 hpf. p<0.05 * relative to LD Control, or # relative to LL Control (one-way ANOVA), n = 28 per treatment group. |

