|
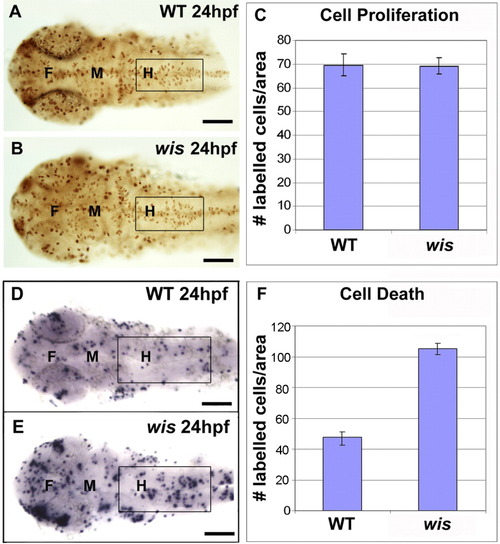
Cell proliferation and cell death analysis in whitesnake mutants. A-C: Cell proliferation analysis, using PH3 antibody labeling. A,B: Fixed and labeled wild-type and wis brain at 24 hours postfertilization (hpf). C: Quantification comparing labeling in hindbrain shows no difference between wild-type and mutant, n = 8; P = 0.8046. D-F: Cell death analysis, using terminal deoxynucleotidyl transferase-mediated deoxyuridinetriphosphate nick end-labeling (TUNEL) staining. D,E: Fixed and labeled wild-type and wis brain at 24 hpf. F: Quantification comparing labeling in hindbrain shows approximately twice the amount of cell death in the mutant than in wild-type, n = 14; P < 0.0001. Error bars denote standard error. A-B,D-E: Dorsal views. Boxes mark regions used for quantitation. F, forebrain; M, midbrain; H, hindbrain. Scale bar = 100 μm.
|