
Fig. 2
- ID
- ZDB-FIG-061121-2
- Publication
- Mann et al., 2006 - Comparison of neurolin (ALCAM) and neurolin-like cell adhesion molecule (NLCAM) expression in zebrafish
- Other Figures
- All Figure Page
- Back to All Figure Page
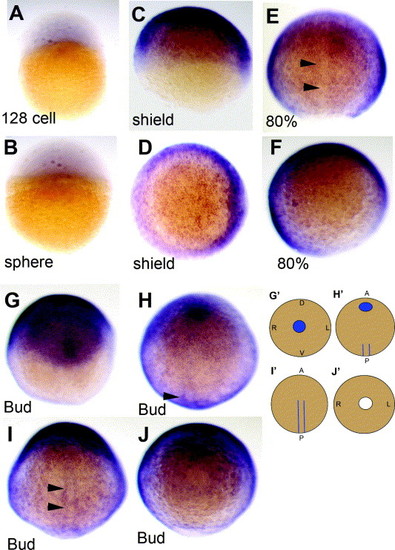
NLCAM mRNA is widespread during the gastrulation phase. (A and B). Low level signal in 128-cell and sphere stage, in lateral view. (C–F) Shield (C and D) and 80% epiboly (E and F) embryos in lateral (C), dorsal (E) and animal pole (D and F; shield to the right) view, showing widespread expression but reduction in the midline (arrowheads). (G–J) A single bud-stage embryo viewed in successive rostro-caudal ∼90 ° rotations: A (anterior); P (posterior); D (dorsal); V (ventral); L (left); R (right). Note the elliptical head region (G) and the posterior adaxial stripes (H and I, arrowheads). These are represented in cartoon form in (G′–J′). Blue indicates regions of higher signal compared to the gastrulating embryo and white, the blastopore. |
| Gene: | |
|---|---|
| Fish: | |
| Anatomical Term: | |
| Stage Range: | 128-cell to Bud |
Reprinted from Gene expression patterns : GEP, 6(8), Mann, C.J., Hinits, Y., and Hughes, S.M., Comparison of neurolin (ALCAM) and neurolin-like cell adhesion molecule (NLCAM) expression in zebrafish, 952-963, Copyright (2006) with permission from Elsevier. Full text @ Gene Expr. Patterns