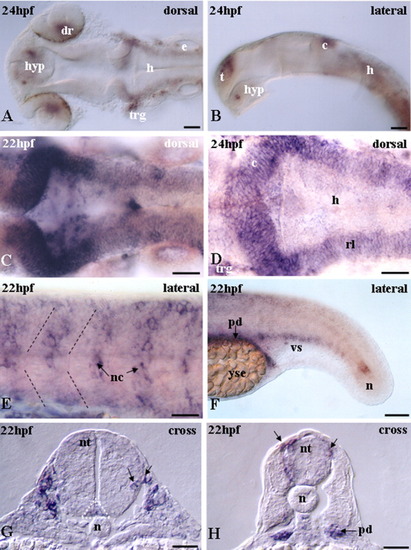
Expression of id2 at the end of the first day of development. A,C,D: Dorsal views; B,E,F: lateral views; G,H: cross-sections. A: Transcripts in the hypothalamus, dorsal retina, trigeminal ganglia, hindbrain, and ear. B: Eyes dissected out to demonstrate id2 transcripts in the hypothalamus. C,D: Dorsal layer in the neural tube expresses id2. E: Black broken lines indicate somite boundaries and id2 riboprobe stains the characteristic migratory neural crest cells in the trunk. This finding is also indicated by black arrows in G,H. The lateral stripe of id2 expressing cells in Figure 2E,F is confirmed to be the pronephros, which develops into the pronephros duct as seen in F,H. F: Ventral cells and the end of the notochord faintly express id2 at 22 hours postfertilization (hpf). G: Transcripts in the neural crest and floor plate (white dotted triangle). H: Transcripts in the neural crest and pronephros duct. c, cerebellum; dr, dorsal retina; e, ear; h, hindbrain; hyp, hypothalamus; n, notochord; nc, neural crest; nt, neural tube; pd, pronephric ducts; rl, rhombic lip; t, telencephalon; trg, trigeminal ganglion; yse, yolk cell extension; vs, ventral somites. Scale bars = 50 μ m.
|
