Fig. 3
- ID
- ZDB-FIG-051114-2
- Publication
- Julich et al., 2005 - beamter/deltaC and the role of Notch ligands in the zebrafish somite segmentation, hindbrain neurogenesis and hypochord differentiation
- Other Figures
- All Figure Page
- Back to All Figure Page
|
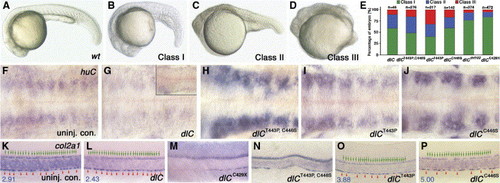
Morphology and molecular characterization of embryos injected with different constructs of deltaC mRNA. (B–D) Injected embryos display a range of phenotypes that can be grouped into three distinct classes showing various degrees of retarded growth and axial defects. Wild-type (A, wt) at approximately at 22 hfp, Class I (B) embryo with delayed growth, Class II (C) embryo with retarded growth, malformed tail and short body axis and Class III (D) embryo with severe retarded growth, short body axis without notochord and somites (with defects mainly attributed to injection artifacts). (E) Bar graph displays the relative proportions of each morphological class in response to the different constructs of deltaC mRNA injected, n: numbers of examined embryos. huC staining of uninjected control (F), class I dlC-injected (G, class II in the insert), class I dlCT443P, C446S-injected (H), class I dlCT443P-injected (I) and class I dlCC446S-injected (J) embryos at approximately 30 hpf. Note that while neurons are increased in dlCT443P, C446S-, dlCT443P- and dlCC446S-injected embryos, huC-positive neurons are decreased in dlC-injected embryos. Lateral view of ∼30 hpf embryos labeled for col2a1 RNA expression in uninjected control (K, fp/hc = 3.04 ± 0.32, n = 6), class I dlC-injection (L, fp/hc = 2.32 ± 0.10, n = 5), class I dlCC429X-injection (M): 30.4% (52/171) embryos have more severe anterior hypochord phenotype than uninjected beatit446 mutants; 75% (42/56) class II dlCC429X-injected embryos have more severe anterior hypochord phenotype, class I dlCT443P, C446S-injection (N): 11.5% (7/61) embryos have gaps in between hypochord cells while 88.5% embryos (54/61) have small and localized gaps (not shown), class I dlCT443P-injection (O): most of the embryos were found to have floor-plate and hypochord cells morphologically similar to those of beatm98 mutant, while 6.9% (3/43) of the embryos have gaps in hypochord (not shown) and class I dlCC446S-injection (P): 57.1% (12/21) embryos have elongated hypochord cells. Each green arrow indicates a floor-plate cell; each red arrowhead indicates the boundary between two hypochord cells. The blue number at the bottom left corner is the ratio of number of floor-plate cells to number of hypochord cells (fp/hc). All floor cells plate look normal. Anterior is to the left (F–O) and dorsal to the top (K–O). fp/hc ratio is expressed in average ± standard deviation format; n: numbers of examined embryos. |
| Genes: | |
|---|---|
| Fish: | |
| Anatomical Terms: | |
| Stage: | Prim-15 |
Reprinted from Developmental Biology, 286(2), Julich, D., Hwee, Lim C., Round, J., Nicolaije, C., Schroeder, J., Davies, A., Geisler, R., Lewis, J., Jiang, Y.J., Holley, S.A., Tübingen 2000 Screen Consortium., beamter/deltaC and the role of Notch ligands in the zebrafish somite segmentation, hindbrain neurogenesis and hypochord differentiation, 391-404, Copyright (2005) with permission from Elsevier. Full text @ Dev. Biol.

