- Title
-
The shaping of the pharnygeal cartilages during early development of the zebrafish
- Authors
- Kimmel, C.B., Miller, C.T., Kruse, G., Ullmann, B., BreMiller, R.A., Larison, K.D., and Snyder, H.C.
- Source
- Full text @ Dev. Biol.
|
Pharyngeal cartilages and their arrangements of chondrocytes. (A) Diagram of the segmental series of cartilages of the young larva, in a left-side view above (dorsal to the top and anterior to the left) and in a ventral view below. P and M are dorsal and ventral cartilages of the mandibular (first pharyngeal) arch (all abbreviations used in this paper are listed at the end of this legend). HS and CH are their putative homologues in the hyoid (second pharyngeal) arch. CB1-4 bear the set of four gills and CB5 (seventh pharyngeal arch) bears teeth. BH and BB are in the ventral midline (see Schilling and Kimmel, 1997 for a description of all of these cartilages and features of their development). (B) Dorsolateral surface view of the HM. Nomarski imaging in the live 5-day larva, revealing the mosaic-tile appearance of its cells. The arrow points to a nerve that passes through the hole in the HM, prominent in other figures (e.g., D), the hyomandibular foramen. Striated muscle fibers of LAP are also evident. Through-focus sectioning reveals that no chondrocytes are present above or below the plane of focus in the figure; there is only a single layer of them. (C) Horizontal Epon 7.5-μm section through the pharynx at 4 days, stained with methylene blue and basic fuchsin. Cartilage matrix is colored purple, the final magnification is the same as for B. The section passes through the HM, and through CB1–3. The HM cells in such sections have a low-columnar appearance; a view across such a plate of cartilage is rather like a view along a thinner rod of cartilage such as the SY (i.e., the view of the HM here is similar to the view of the SY in D). Sections across the rod-like cartilages, here illustrated for CB1–3, show disk-shaped single cellular profiles, revealing that the cartilages have the structure of a stack of coins or checkers. Irrespective of the form of the cartilages, or how the chondrocytes are arranged, the overlying, immediately adjacent layer of perichondrial cells is flattened onto the cartilage and forms a rather complete sheath. Perichondrial cell nuclei are more elongated and compact than chondrocyte nuclei. (D) Alcian green-stained cartilages, dissected out from a 5-day larva and flat-mounted (see Materials and Methods). The presentation shows all of the chondrocytes present in these cartilages, and their organization. They lie in rows, roughly parallel to the long axes of the cartilages (i.e., the rows run roughly horizontally in P, SY, and HM, and vertically in CH). Rows are not evident in the IJ. The method does not distort the cartilage shapes, but may disturb the articulations and the positional relationships between adjacent cartilages. Hence the in vivo positional relationships of these elements is better shown in A than D. Scale bars: 100 μm. Abbreviations: BB, basibranchial; BH, basihyal; CB1–5, ceratobranchials 1–5; CH, ceratohyal; HM, hyomandibular region of the HS; HS, hyosymplectic; IH, interhyal; IJ, interhyal joint region of the HS; LAP, levator arcus palatini muscle; M, Meckel’s; P, palatoquadrate; SY, symplectic region of the HS. |
|
Chondrocyte stacks in the young HS. (A–C) An Alcian blue-stained, dissected, and flat-mounted preparation at 3 days. The cells in the IJ are smaller and less brightly stained than elsewhere in the cartilage (shown in A), correlating with the fact that they are the last to chondrify (Schilling and Kimmel, 1997; see also Fig. 4). B shows that the IJ cells overlap considerably, in contrast to the SY and HM, where they are arranged within a single layer. They are aligned into a single row (a stack) in the anterior SY (to the left), where the cells are checker-shaped and have exactly two neighbors, ignoring the perichondrium. Closer to IJ the SY cells typically have more than 2 neighbors, as in this example. Stacked cell arrangements are also evident in the HM. The HM cells are polygonal; individual cells mostly have 5 or 6 neighbors. In C a side of a polygon is only drawn if it is noticeably longer than other sides, and if the apposition is with only a single adjacent cell. This presentation facilitates picking out the stacked cell arrangement in the HM; stacks are present where a row of long boundaries lie in parallel. The stacks run from left to right, along the long axis of the HM, and they also point upward toward the upper apex where a prominent joint is made with the chondrocranium (this apex is actually the HM’s dorsal–anterior apex since the cartilage is obliquely oriented in the animal, see Fig. 1A). Note that no stacks swing downward, in the opposite direction, to the posterior–ventral apex where a joint is made with the opercular bone. These features seem invariant, whereas detailed arrangements of the cells and stacks vary considerably among different examples at the same stage (including the pair of cartilages on the left and right sides of a single individual). Scale bar (A–C): 100 μm. (D, E) Nomarski views of the SY in a live embryo at 65 h and a live larva at 97 h postfertilization. The arrow points to the anterior end of the SY cartilage, its left end in the figure. The accompanying drawings outline SY cells, reconstructed from multiple focal plane Nomarski images. At the earlier stage (D) the cells are coin-shaped; within a few hours they plump into a puck-shape. By 97 h (E) the cells have enlarged considerably; the increase in area in the plane of view is about 2.7-fold. Scale bars (D, E): 50 μm. |
|
Formation of the SY cell stacks. Two examples (A and B, C–E) are shown. Cells were labeled in the early embryo, by injection with rhodamine–dextran (see Methods and Materials) and the SY, when containing labeled descendants of the injected cells, was photographed in the same two live larvae at 3 days (A, C) and 4 days (B, D) of development. The micrographs show overlays of single-plane images of epifluorescence (with fluorescent labeling pseudo-colored red) and with Nomarski bright-field illumination through the same SY cartilage at the two stages. Anterior is to the left. The accompanying drawings show the SY cell stack reconstructed from the multiple focal plane Nomarski images, with the labeled chondrocytes stippled. In A and B the three labeled cells to the right are perichondrial cells, not chondrocytes, and they are not included in the drawings. The numbers show how many unlabeled cells are distributed along the cartilage relative to the positions of the labeled ones. The dotted cell outlines to the right show a few of the unstacked cells present in the IJ. Between the two time points unlabeled cells add preferentially to the posterior SY (to the right) in these examples, and in another case analyzed similarly. (C) An enlargement of the local region including the labeled cells in the second larva. The number within each cell indicates the number of chondrocyte neighbors it contacts. Less contacts are made at the older stage, presumably due to cellular intercalations occurring between the two times, and that make the more orderly stack at the later time. Scale bar: 50 μm for A–D, 25 μm for E. |
|
Disruption of the SY cell stack during growth. Alcian green-labeled flat mounts, and accompanying tracings of the chondrocyte outlines. (A) An example at day 4. The SY cells are neatly stacked (compare with other examples in Figs. 1D, 2, and 3). (B, C) and (D, E): The left–right pairs of two larvae at day 8. Cellular addition variably disrupts the early stacks. The cells in many regions are substantially overlapped. Scale bar: 100 μm. |
|
Chondrocyte arrangements in advanced larval cartilages. Horizontal 5-μm Epon sections through the pharynx at day 8, stained with methylene blue and basic fuchsin. The sections were selected from a serial series running ventral (A) to dorsal (C). Anterior is to left and medial is to the top. Chondrocyte cytoplasm is pale, such that the dark cell appositions and nuclei are prominent. Note the thin perichondrial layer around each of the cartilages and the chondrocyte in late telophase (arrow in C). Scale bar: 50 μm. |
|
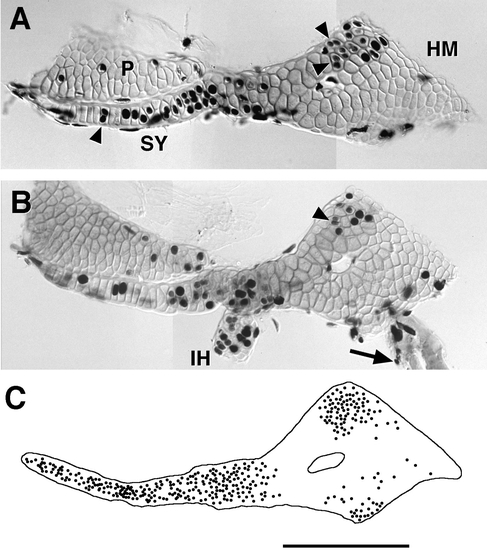
Bromodeoxyuridine labeling of the growing HS. (A, B) Two examples at day 4.5, after exposure to BrdU for 1 day (and refreshed at 6-h intervals), counterstained with Alcian green. Labeled round-shaped nuclei are chondrocyte nuclei, whereas the thin elongated nuclei are of mesenchymal perichondrial cells. Arrowheads show examples of pairs of small labeled chondrocyte nuclei present together in a single lacuna, probably representing the pair of daughter cells stemming from a single mitosis that occurred during the day-long exposure. Examination with Nomarski optics confirms that the two nuclei are within separate cells that had not yet formed an intervening Alcian-positive matrix. We did not observe such pairs if the labeling time was less than 4 h, even though many single labeled nuclei were present (data not shown). This would mean that 4 h is about the minimal time that it takes for a chondrocyte captured by BrdU incorporation in the S phase of the cell cycle to have completed that cell cycle and divided (i.e., 4 h is approximately the length of the G2 + M phases of the cell cycle). In B labeling is also present in the IH and in cells overlying the forming opercular bone (arrow), which articulates with the HM’s ventral–posterior apex. (C) The location of every labeled chondrocyte nucleus in 12 cartilages, exposed to BrdU as in (A, B) is plotted on a single overlay, revealing that the distribution of labeling is markedly nonrandom. The central region of the HM is practically devoid of labeled chondrocytes, showing it to be a region where the cells are not dividing. Quantitative analyses (not shown) reveal that significantly more labeled cells occupy the region of the HM’s dorsal–anterior apex (to the top) than its posterior–ventral apex (to the bottom; P < 0.001; t test). This finding suggests that chondrocytes are dividing more rapidly in the dorsal–anterior apical region, since there is no difference in how tightly the cells are packed within the two regions. The IJ, the region of the HM adjacent to it, and the SY are also regions where cells appear to be dividing at a relatively high rate. Scale bar: 100 μm. |
|
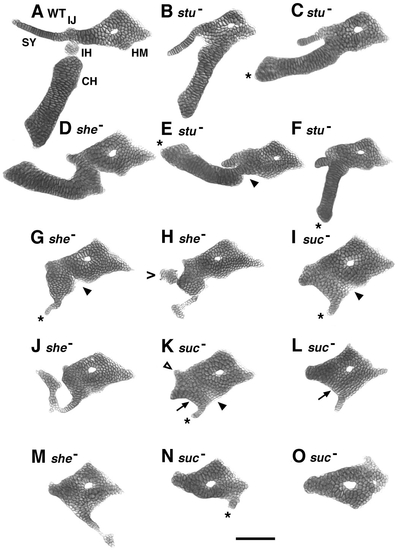
A phenotypic series in the shapes of mutant hyoid cartilages. Flat-mounted dissected preparations from stu, she, and suc mutants at day 5, arranged according to how much hyoid arch cartilage is present. A wild-type preparation is also included (A). The highly variable she- phenotype overlaps both stu- and suc-. Two she- examples (G, H) fall in the middle of the series. Another (D) fits ahead of stu mutants, and two (J, M) fit after one or more suc- examples. Our interpretation of the identities of particular regions of cartilage is explained in detail in the text. In contrast to disruption of the ventrolateral hyoid (CH, IH, SY) cartilages, the dorsal HM region is readily identifiable and reasonably normal in shape and size in every mutant we examined, even though it is nearly invariably fused to other cartilages. The assignment is based on the following features, shared with the HM in wild types: The mutant HM is present as a diamond-shaped region of cartilage that articulates with the otic capsule at its dorsal–anterior apex. The HM is located just posterior to a cartilage we interpret to be its mandibular arch homologue, the palatoquadrate (e.g., as shown in Fig. 10). Muscles insert to the mutant HM that from their origins on the chondrocranium seem to be the correct ones (see Schilling and Kimmel, 1997). The mutant HM invariably has a central hole, corresponding to the wild-type hyomandibular foramen. Finally, the mutant HM is often associated with a bone primordium we interpret to be the opercular, at a posterior–ventral apex of the HM as usual (example in Fig. 10). In all three mutants, ectopic small cartilages of unknown identity are often present (H; .), emphasizing the need for region-specific molecular markers that are only beginning to become available (Schilling, 1997). Asterisks (C, E, F, G, I, K, N) indicate the position we take to be the tip of the mutant CH. The triangle (K) indicates a stub of cartilage corresponding in position to the SY. Arrowheads (E, G, I, K) indicate where we propose the joint between the HM and the CH would normally form. Arrows (K, L) show chondrocyte stacks curving ventrally from the IJ. Such curving cell stacks are also present in other mutants in this part of the series (e.g., J) but are never observed in wild types (e.g., Fig. 2). Scale bar: 100 μm. PHENOTYPE:
|
|
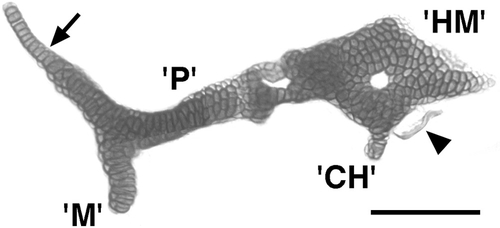
A similar suc- phenotype occurs in the mandibular and hyoid arches. Flat-mounted dissected preparation at day 5. There is tight apposition, but not a fusion, between the cartilages that we identify as the mutant equivalents of the dorsal segmental homologues, P in the mandibular arch and HM in the hyoid arch. The apposition between them is topologically as in wild types; occurring just where the SY normally would be present (Fig. 1). The palatoquadrate possesses a pterygoid process that appears normal in form (arrow). The ventral segmental homologues, M and CH, are drastically reduced and are fused to the dorsal elements at about the locations where the dorsal–ventral joints should occur in both arches, but which are missing in both. A small fragment of bone is present beside the posterior–ventral surface of the HM (arrowhead), about the region where the opercular bone normally develops. Scale bar: 100 μm. PHENOTYPE:
|
Reprinted from Developmental Biology, 203, Kimmel, C.B., Miller, C.T., Kruse, G., Ullmann, B., BreMiller, R.A., Larison, K.D., and Snyder, H.C., The shaping of the pharnygeal cartilages during early development of the zebrafish, 245-263, Copyright (1998) with permission from Elsevier. Full text @ Dev. Biol.


