- Title
-
dldhcri3 zebrafish exhibited altered mitochondrial ultrastructure, morphology and dysfunction partially rescued by probucol or thiamine
- Authors
- Lavorato, M., Iadarola, D., Remes, C., Kaur, P., Broxton, C., Mathew, N.D., Xiao, R., Seiler, C., Nakamaru-Ogiso, E., Anderson, V.E., Falk, M.J.
- Source
- Full text @ JCI Insight
|
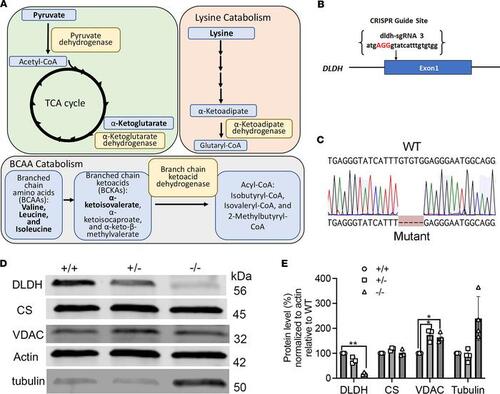
DLD role in metabolic pathways, generation of the dldh–/– zebrafish model, and confirmation of Dldh protein deficiency in dldh–/– zebrafish larvae. (A) Scheme representing enzyme complexes incorporating a functional DLD (E3) subunit: PDHc is the gateway enzyme to the TCA cycle, and AKADHc and BCKADHc are essential enzymes in lysine and BCAA catabolism, respectively. (B) CRISPR/Cas9 construction of dldh–/– zebrafish. Schematic showing where sgRNA targets exon 1 after start codon (ATG); the sgRNA was injected 1 hpf. (C) Sanger confirmation of 5 bp deletion in dldhcri3 zebrafish. (D) Immunoblot of Dldh protein level in 7 dpf WT, dldh+/–, and dldh–/– larvae. (E) ImageJ quantification of Dldh, CS, VDAC, and tubulin protein levels in WT vs. 7 dpf dldh–/– larvae, showing significantly decreased Dldh expression in dldh–/– larvae and increased VDAC levels in dldh+/– and dldh–/–; n = 3; *P < 0.05 and **P < 0.01, unpaired Student’s t test with the Bonferroni correction. Data are shown as mean ± SD. |
|
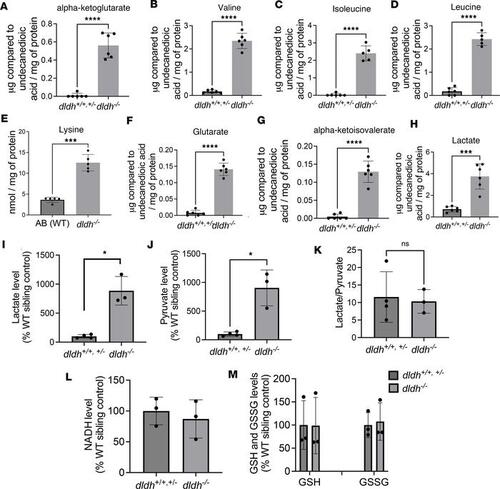
DLD-dependent enzyme metabolite analysis and mitochondrial function in dldh–/– zebrafish larvae. (A–H) Biochemical analysis by GC/MS of DLD-dependent enzyme metabolite and aa, relative to undecanoic acid standard and normalized to protein α-ketoglutarate, valine, isoleucine, leucine, lysine, glutarate, α-ketoisovalerate, and lactate in 7 dpf WT (dldh+/+ and dldh+/–)and dldh–/– zebrafish larvae. n = 5 biological replicates/condition. ***P < 0.001; ****P < 0.0001; Welch’s unpaired t test. Data are shown as mean ± SD. (I–K) Lactate and pyruvate, analyzed using lactate and pyruvate oxidase-based colorimetric assays, in 7 dpf dldh–/– zebrafish larvae. Data were normalized to WT sibling controls. *P < 0.05. Student’s t test. (L and M) Analysis of NADH and GSH and GSSG levels (percentage of control) showed no differences between dldh–/– and WT larvae at 7 dpf. All colorimetric analyses were conducted on 4 WT and 3 dldh–/– larval biological replicate samples. Data are shown as mean ± SD. PHENOTYPE:
|
|
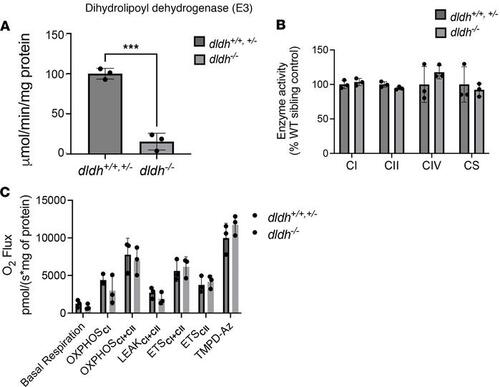
Unchanged RC enzyme activity and mitochondrial respiration capacity in dldh–/– zebrafish larvae. (A) Measurement of the DLD (E3) activity in dldh–/– zebrafish showed significantly decreased activity as compared with WT; n = 3; ***P < 0.001 by Student’s t test. (B) Enzyme activities of complex I (CI), CII, and CIV and citrate synthase (CS); n = 3. Data are shown as mean ± SD. No significant differences between 7 dpf dldh/ larvae and WT by Student’s t test. (C) Oxygen flux measurements obtained by high-resolution polarography with an Oxygraph-2k (Oroboros) on 5 dpf zebrafish homogenate. Basal respiration is the measurement before addition of substrates. OXPHOSCI is the capacity of CI taken after the addition of glutamate. OXPHOSCI+CII is the capacity of both CI+CII taken after the addition of succinate. LEAKCI+CII is the nonphosphorylating electron transfer across the mitochondrial inner membrane. ETSCII is in the presence of succinate and rotenone. TMPD-Az is the ascorbate driven complex IV activity. A typical time course and experimental details are presented in Supplemental Figure 3C. None of the differences reached statistical significance by Welch’s t test. Data are shown as mean ± SD (n = 3). PHENOTYPE:
|
|
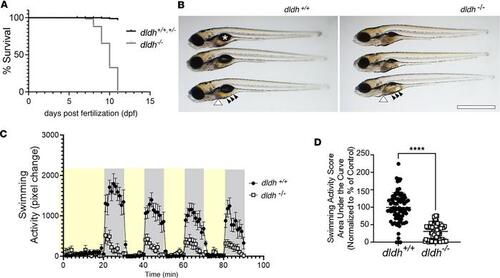
Decreased survival, abnormal gross morphology, and reduced swimming activity in dldh–/– zebrafish larvae. (A) dldh–/– larvae had reduced survival relative to WT larvae, with mortality starting at 8 dpf; n = 300 each strain, across 3 biological replicates; log-rank (Mantel-Cox) test: P < 0.0001; median survival of dldh–/–: 10 dpf. Death was defined by absent heartbeat. (B) Morphological analysis at 7 dpf showed dldh–/– zebrafish larvae had enlarged liver (white arrowhead), darker intestine (black arrows) with universal finding of uninflated swim bladder (asterisk in WT), relative to WT larvae. Scale bar: 0.5 mm. (C) Larval swimming activity (ZebraBox platform and ZebraLab software) tracing showed reduced dldh–/– mutant swimming (open circles) in dark periods (gray) at 7 dpf. Larvae were exposed to 3 consecutive 10-minute 100% light (yellow) and 10-minute dark cycles following a light/dark acclimation period. Each point shows average (mean + SEM) activity of 84 larvae/strain. (D) dldh–/– swimming activity at 7 dpf during dark cycles analyzed by AUC, with group comparison. ****P < 0.0001 by unpaired Student’s t test. Data are shown as mean ± SEM. n = 84 larvae across > 3 biological replicate experiments per strain. PHENOTYPE:
|
|
Liver pathology in dldh–/– zebrafish larvae. (A and B) WT and dldh–/– morphology at 7 dpf showed mutants had increased liver size (yellow line) and deflated swim bladder (arrow). Scale bar: 100 μm (×2.5 magnification of the middle fish in Figure 4B). (C and D) Oil Red O staining of 8 dpf WT and dldh–/– liver showed increased lipid accumulation in mutant larvae. Scale bar: 100 μm. (E) Liver area (μm2) was increased in 14 dldh–/– relative to 11 WT larvae by ImageJ analysis across 3 replicate experiments. ****P < 0.0001 by unpaired Student’s t test. (F and G) Thin sections of WT and dldh–/– liver stained with toluidine blue showed mutant larvae had increased frequency of lipid droplets (arrowheads). Scale bars: 10 µm. (H and I) Hepatocyte ultrastructure in 7 dpf WT and dldh–/– showed mutant larvae had mitochondrial damage (M) and large lipid droplets (L). Scale bars: 1 µm. (J) Ultrastructural analysis showed increased fractional lipid droplet to liver area analyzed in 4 WT and 3 dldh–/– larvae at 7 dpf. Areas determined using ImageJ. *P < 0.05 by unpaired Student’s t test. PHENOTYPE:
|
|
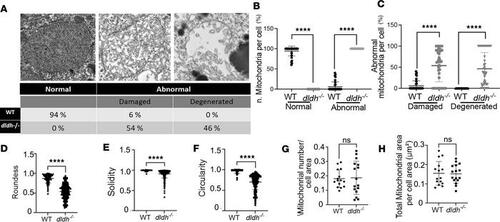
Mitochondrial ultrastructure changes in 7 dpf dldh–/– liver mitochondria. (A) “Normal” and “abnormal” (damaged and degenerated) ultrastructure representative images above summary table for analysis of 3 WT and 3 dldh–/– zebrafish from 34 (WT) and 43 (dldh–/–) cells and 209 (WT) and 635 (dldh–/–) mitochondria analyzed (the “damaged” mitochondrion is present in Figure 5I image). (B) Scatter plot showing percent of normal and abnormal mitochondria per cell, as described in A. Data are shown as mean ± SD. (C) Percent of abnormal mitochondria classified as damaged or degenerated, as described in A. (D–F) Morphological features analyzed: roundness, solidity, and circularity quantifying mitochondrial shape integrity in WT and dldh–/– larvae. (G) Mitochondria number relative to cell area (μm–2). Points indicate mitochondria number per cell. (H) Total mitochondrial area relative to cell area. (D–H) Mitochondria, n = 148 (WT) and 245 (dldh–/–); cells, n = 15 (WT) and 16 (dldh–/–). Data are shown as mean ± SD. All statistical analyses by unpaired Student’s t test. ****P < 0.0001. PHENOTYPE:
|
|
Intestinal mitochondria in 7 dpf dldh–/– larvae showed depletion of mitochondria with matrix chamber swelling and elongation. (A and B) Mitochondria ultrastructure (light blue) was nicely rounded in WT intestinal cells with well-organized rough reticulum (A), while intestinal cells of 7 dpf dldh–/– zebrafish larvae showed mitochondria (light blue) swelling, damage, and elongation (B). (C–E) Mitochondria ultrastructural morphological features quantified in intestinal cells of WT and dldh–/– larvae mutant larvae. Mitochondria, n = 504 (WT) and 190 (dldh–/–) in 16 cells (WT) and 13 cells (dldh–/–) from 3 WT and 3 dldh–/– larvae. (F–H) Average mitochondrial area, total mitochondrial area, and mitochondria number relative to cross-sectional area . Analysis confirmed increased mitochondrial area and decreased number of mitochondria in dldh–/– larvae relative to WT. All characteristics determined with ImageJ; statistical analyses by Student’s t test, and each point represents data from 1 cell. ****P < 0.0001; **P < 0.01. Data are shown as mean ± SD. PHENOTYPE:
|
|
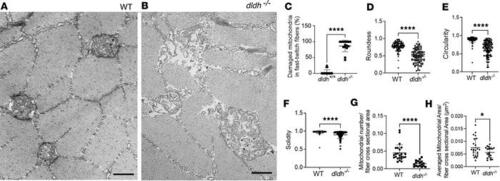
Mitochondria ultrastructural changes in 7 dpf dldh–/– larvae fast-twitch skeletal muscle fibers. (A and B) Mitochondrial ultrastructure was grossly disrupted in 7 dpf dldh–/– fibers, as compared with WT. Scale bars: 500 nm. (C) Percentage of damaged mitochondria in WT and dldh–/– fibers. (D–F) Mitochondrial ultrastructure morphological features of roundness, circularity, and solidity were quantitatively analyzed using ImageJ. (G and H) Mitochondria number relative to fiber cross-sectional area (μm–2) and average mitochondrial area per fiber cross-sectional area were analyzed using imageJ. In total, 110 (WT) and 102 (dldh–/–) in 24 (WT) and 15 (dldh–/–) fast-twitch muscle fibers from 3 WT and 3 dldh–/– larvae were analyzed. ****P < 0.0001, *P < 0.05 by unpaired Student’s t test. Data are shown as mean ± SD. PHENOTYPE:
|
|
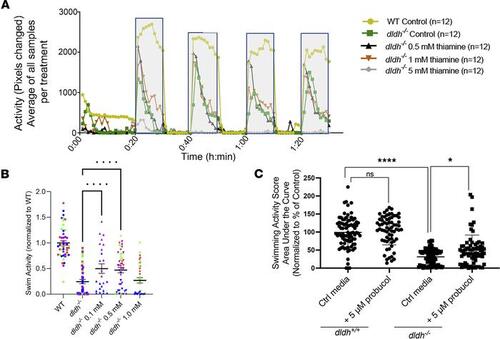
Preclinical candidate drug screening in dldh–/– zebrafish larvae. (A) Representative ZebraBox activity time course as in Figure 4C for WT (olive), dldh–/– (green), and dldh–/– treated with 0.5, 1.0, or 5.0 mM thiamine (black, orange, gray), respectively. Notably, at 5.0 mM thiamine, there was minimal observable swim activity (n = 3 biological replicates). (B) Four replicates of the effect of 0.1, 0.5, or 1 mM thiamine treatment from 4 dpf to 6 dpf on the swimming activity of dldh–/– zebrafish larvae. Quantitation across the dark cycles was by AUC. Four biological replicates are represented by coloring the data points red, green, blue, or purple. One-way ANOVA with multiple comparisons to dldh–/– identified treatment with either 0.1 or 0.5 mM as enhancing the swimming activity of the dldh–/– by ~100%; **P < 0.01. (C) Similarly, probucol treatment (5 μM, 4–dpf) also increased swim activity of 7 dpf dldh–/– zebrafish larvae (*P ≤ 0.05 by unpaired Student’s t test with a Bonferroni correction) but not of WT; n = 5 biological replicates per condition, n = 12 zebrafish larvae for each condition per biological replicate experiment PHENOTYPE:
|

