
- Title
-
Loss of function of Vasoactive-intestinal peptide alters sex ratio and reduces male reproductive fitness in zebrafish
- Authors
- Yu, Y., Tanaka, S., Wong, T.T., Zohar, Y., Zmora, N.
- Source
- Full text @ Endocrinology

vipa−/− zebrafish males are subfertile. Fertilization, fecundity, and survival rates of embryos produced by crossing vipa−/− males with WT females (n = 12) and vipa−/− females with WT males (n = 15). (A) Fertilization, (B) fecundity, and (C) survival rates at 48 dpf. Statistical analysis performed using Welch 2-ample t-test. (D) Fertilization rates of embryos from in vitro fertilization of sperm from vipa−/− males and oocytes from WT females (n = 8), or oocytes from WT females and WT sperm (n = 8). Statistical analysis performed using 1-way ANOVA, followed by Tukey's multiple comparisons test. ****P < .0001, ***P < .001, **P < .01, ns = P ≥ .05. |

vipa−/− males display reduced attraction to female. vipa−/− and WT males’ distance from WT female and male zebrafish and the time spent near confined females or males. (A) Time spent within 30 mm of female/male chambers by vipa−/− and WT males (n = 5 males of each type, respectively). (B) Tracking distribution map of a representative male of each type (WT and vipa−/−) using idTracker software to assess images taken at 30 frames/second intervals. (C) Thirty-second representative tracking videos of a vipa−/− (left) and WT male (right) with the same confined WT female (circled). Statistical analysis for (A) was performed on mean values using 1-way ANOVA, followed by Tukey's multiple comparisons test, ****P < .0001. |

Gonadal morphology and gametogenesis of vipa−/− and WT testes. Gross testes morphology (in situ) of 2 representative vipa−/− and WT adult males (A; top row), and after excision (B; bottom row). (C) Testis histology with hematoxylin and eosin staining of vehicle-treated vipa−/− male. (D) Testis histology with hematoxylin and eosin staining of methyl-testosterone treated vipa−/− male. (E) Testis histology with hematoxylin and eosin staining of WT male. (F) Average GSI of WT and vipa−/− males (n = 6). Statistical analysis performed using the Welch 2-sample t-test. P (GSI) = .0092 and .0002, **P < .01, ***P < .001. |

Vipa−/− males display reduced sperm quality (A) average sperm density of WT and vipa−/− (n = 4). (B) Average sperm motility (n = 8), and (C) average progressive motility (n = 8). (D, E) sperm motility tracking of WT and vipa−/− males. Arrows point to either progressive (PM) or nonprogressive (NPM) motility paths. (F, G) Tracking video for vipa−/− and WT male sperm. Statistical analysis performed Welch 2-sample t-test. P (sperm density) = .0062, P (PM) < .0001, and P (NPM) < .0001. ****P < .0001, **P < .01. |

Vipa mRNA and peptide are detected in zebrafish testis. In situ hybridization using vipa antisense riboprobe (A, B) and sense riboprobe (C) on sections from WT testis. Arrows point to cells where the positive signal was observed with the antisense riboprobe. Immunostaining of WT (D, E) and vipa−/− (F) testis with anti-Vipa precursor, and WT with preimmune serum (G). LC, Leydig cells; Ps, prespermatogonia; Spc I, primary spermatocytes; Spg, spermatogonia; Sptd, spermatids. |
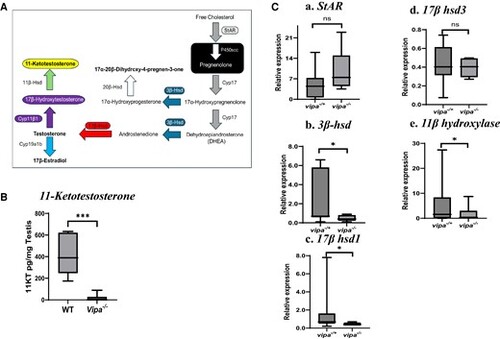
The effect of loss of vipa on androgen synthesis and sex steroid hormone levels. (A) Schematic diagram of androgen synthesis pathway in Leydig cells in teleost (Adopted from (63). Each enzyme is signified by a color-coded arrow. (B) 11-Ketotestosterone levels in WT and vipa−/− male testes. (C) Comparison of the expression of genes encode for steroid synthesis enzymes in vipa−/+ and vipa−/− male siblings. (a) StAR, (b) 3β-hsd, (c) 17β-hsd1, (d) 17β-hsd3, (e) 11β-hydroxylase (cyp11β1 or cypc1). Results are presented as mean relative expression ± standard error of mean normalized using NORMA-Gene platform with 7 different genes for the gene expression study. 11-KT levels are presented as pg/mg testis using pairwise analysis with nonparametric statistical analysis. Statistical significance was accepted when P ≤ .05. |