FIGURE SUMMARY
Title

Mis-localization of endogenous TDP-43 leads to ALS-like early-stage metabolic dysfunction and progressive motor deficits

Authors
Hu, Y., Hruscha, A., Pan, C., Schifferer, M., Schmidt, M.K., Nuscher, B., Giera, M., Kostidis, S., Burhan, Ö., van Bebber, F., Edbauer, D., Arzberger, T., Haass, C., Schmid, B.
Source
Full text @ Mol. Neurodegener.

Biochemical characterization of ΔNLS-Tardbp fish. A Schematic drawing shows splicing products from zebrafish 2 orthologs of human TARDBP, tardbp and tardbpl. Zebrafish Tardbp has 2 RNA recognition motifs (RRM1 and RRM2) and a low-complexity domain (LCD). Tardbpl and Tardbpl_tv1 are splicing products from the tardbpl gene. While zebrafish Tardbpl does not have a low-complexity domain, zebrafish Tardbpl_tv1 has 2 RNA recognition motifs (RRM1 and RRM2) and a low-complexity domain. B Western blot analysis with the Tardbpl_tv1 specific antibody 16C8 detects Tardbpl_tv1 levels to be upregulated in tardbp ΔNLS/ΔNLS and tardbp -/- embryos compared to wildtype embryos. TDP DKO larvae in lane 4 serve as a control for the specificity of the Tardbpl_tv1 antibody. Asterics mark unspecific bands. α-tubulin serves as a loading control. C Schematic drawing highlights bipartite nuclear localization sequence (NLS) in zebrafish Tardbp. The ΔNLS-Tardbp mutation was generated in NLS1 by mutating the amino acids KRK to AAA. D Western blot analysis of 3 biological replicates with the Tardbp antibody 4A12 detects reduced Tardbp levels and a band shift to a higher molecular weight in CytoTDP embryos compared to Control (tardbp + / + ; tardbpl -/-) embryos. Semi-quantitative analysis of the Western blots revealed that the Tardbp levels normalized to α-tubulin in 5 dpf CytoTDP embryos (n = 3) are only 18% compared to Control (n = 3) (***p = 0.0004, Unpaired T test)

Morphological characterization of CytoTDP fish. A Quantification of body length of CytoTDP (red dots) and its siblings [Siblings (black arrow heads): tardbp ΔNLS/ + ; tardbpl -/-, Control (black dots): tardbp + / + ; tardbpl -/-] at 2 dpf, 5 dpf and 14 dpf. CytoTDP larvae have a similar body length at 2 dpf but are smaller at 5 dpf and even more severe at 14 dpf. 2 dpf ANOVA test [p = 0.4073, Unpaired T test: Control vs Siblings p > 0.9999, Control vs CytoTDP p = 0.2528, Siblings vs CytoTDP p = 0.2445]; 5 dpf ANOVA test [p = 0.0012, Unpaired T test: Control vs Siblings p = 0.0894, Control vs CytoTDP * p = 0.0414, Siblings vs CytoTDP *** p = 0.0002]; 14 dpf ANOVA test [p < 0.0001, Unpaired T test: Control vs Siblings p = 0.4227, Control vs CytoTDP **** p < 0.0001, Siblings vs CytoTDP **** p < 0.0001]; Control n = 16, Siblings n = 15, CytoTDP n = 16. Error bars indicates ± SD. B Kaplan Mayer blot of CytoTDP (n = 47) and its siblings [Control (tardbp + / + ; tardbpl-/-) (n = 55), Siblings (tardbp ΔNLS/ + ; tardbpl-/-) (n = 130)]. 94.55% of CytoTDP larvae die within one month, only 1.82% CytoTDP larvae survive longer than 3 months. Mantel-Cox test, p < 0.0001. C Pictures of 2 CytoTDP survivors, 5 months old (left panel) and 6 months old (right panel), respectively. Survivors are of smaller size compared to their siblings. Scale bar = 1 cm. D Petri dish with sorted 2 dpf CytoTDP larvae according to their pigmentation phenotype (red arrow) and their siblings (black arrow). Scale bar = 2 mm. E Hypopigmented CytoTDP embryos display strongly reduced pigmentation compared to their siblings at 2 dpf (lateral view, top panel). At 5 dpf the hypopigmentation pigmentation is still clearly visible from a dorsal view (middle panel) but is less pronounced from a lateral perspective (bottom panel). Scale bar = 1 mm

Tardbp localization in CytoTDP fish. A Immunohistochemical stainings of brain (including telencephalon, tectum, hypothalamus, cerebellum and hindbrain) and spinal cord paraffin sections of 5 dpf CytoTDP fish and Control fish show decreased level of Tardbp in the nucleus and increased cytoplasmic Tardbp expression in CytoTDP fish. Black boxes indicate magnified area. Scale bar = 100 μm. B Immunofluorescence stainings of 5 dpf CytoTDP fish and Control fish brain with Tardbp antibody (green) and DAPI (blue) highlighting the relocalization of Tardbp in CytoTDP line. Scale bar = 10 μm

Age dependent movement phenotypes. A Representative locomotor activity path of 1 h video recordings (red path) of one larva of CytoTDP and its siblings [Siblings (tardbp ΔNLS/ + ; tardbpl -/-), Control (tardbp + / + ; tardbpl -/-)] at 5 dpf and 8 dpf. B-D Quantifications of total swimming distance, velocity and duration for CytoTDP (red dots) and its siblings [Siblings (black arrow heads): tardbp ΔNLS/ + ; tardbpl -/-, Control (black dots): tardbp + / + ; tardbpl -/-] at 5 dpf and 8 dpf. Kruskal–Wallis test was used for 3 groups comparisons and Mann–Whitney test was used for 2 groups comparisons. Error bars indicates ± interquartile range. Control n = 21, Siblings n = 50, CytoTDP n = 23. B Swimming distance [5 dpf (***p = 0.0003, Control vs Siblings p > 0.9999, Control vs CytoTDP ** p = 0.0044, Siblings vs CytoTDP **** p < 0.0001); 8 dpf (****p < 0.0001, Control vs Siblings p > 0.9999, Control vs CytoTDP *** p = 0.0002, Siblings vs CytoTDP **** p < 0.0001)]; C Swimming velocity [5 dpf (***p = 0.0006, Control vs Siblings p = 0.3192, Control vs CytoTDP ** p = 0.0052, Siblings vs CytoTDP **** p < 0.0001); 8 dpf (****p < 0.0001, Control vs Siblings p = 0.4565, Control vs CytoTDP *** p = 0.0001, Siblings vs CytoTDP **** p < 0.0001)] D Swimming duration [5 dpf (**p = 0.0032, Control vs Siblings p = 0.5607, Control vs CytoTDP * p = 0.0403, Siblings vs CytoTDP *** p = 0.0004); 8 dpf (p = 0.1043, Control vs Siblings p = 0.9375, Control vs CytoTDP p = 0.0959, Siblings vs CytoTDP * p = 0.0427)]. E 100% stacked bar graph showing mean distribution of small-bouts (white bar) and large-bouts (red bar) swimming distance percentages for CytoTDP, Siblings and Control at 5 dpf and 8 dpf F 100% stacked bar graph showing mean distribution of durations of small-bouts (white bar), large-bouts (red bar) and still time with no movement (grey bar) percentages of Control, Siblings and CytoTDP at 5 dpf and 8 dpf. Control n = 21, Siblings n = 50, CytoTDP n = 23

Reduction of motor neurons and NMJ degeneration in CytoTDP. A Representative images of ChAT stained 20 μm spinal cord sections from Control and CytoTDP at 8 dpf, scale bars = 20 μm. Quantification of ChAT-positive cells per 20 μm section of Control and CytoTDP at 8 dpf. Control vs CytoTDP *** p = 0.0001, unpaired T test, n = 30 sections for each group. B Schematic drawing of a 5 dpf old larva highlighting the last ventral half of the somite (red) before the end of the gut (yellow), which was used for quantifications. C Representative pictures of double whole-mount immunostainings for synaptotagmin 2 (presynaptic marker, red) and bungarotoxin (postsynaptic marker, green) highlighting the NMJ for CytoTDP and Control at 8 dpf and 16 dpf. CytoTDP and Control have similar NMJ structure at 8 dpf, while 16 dpf CytoTDP have misaligned presynaptic and postsynaptic staining indicative of a degenerated NMJ. Boxes indicate magnified area. Arrowheads in 16 dpf CytoTDP merge magnified image point to non-overlapping synaptotagmin 2 (red) and bungarotoxin (green) stainings. Scale bar = 150 µm. D Quantification of colocalized presynaptic and postsynaptic markers in the last ventral half of the somite before the end of the gut in CytoTDP and Control at 8 dpf and 16 dpf. Unpaired T test: 8 dpf Control vs 8 dpf CytoTDP p = 0.8819, 16 dpf Control vs 16 dpf CytoTDP * p = 0.0187, 8 dpf Control vs 16 dpf Control p = 0.7551, 8 dpf CytoTDP vs 16 dpf CytoTDP * p = 0.0215; each group n = 8; Error bars indicates ± SD. E Quantifications of musculature area of the last ventral half somite before the end of the gut in CytoTDP and Control fish at 8 dpf and 16 dpf. Unpaired T test: 8 dpf Control vs 8 dpf CytoTDP **** p < 0.0001, 16 dpf Control vs 16 dpf CytoTDP **** p < 0.0001, 8 dpf Control vs 16 dpf Control **** p < 0.0001, 8 dpf CytoTDP vs 16 dpf CytoTDP p = 0.0157; n = 7 larvae for each group. Error bars indicates ± SD

Mislocalization of endogenous TDP-43 causes muscle atrophy. A Representative electron microscopy (EM) images for CytoTDP and Control skeletal muscle at 8 dpf. CytoTDP have well-organized myofibrils and no obvious muscle atrophy at 8 dpf compared to Control. B Representative EM images for CytoTDP and Control skeletal muscle at 16 dpf. 16 dpf CytoTDP have a dilated sarcoplasmic reticulum (SR) (arrows) and significant muscle atrophy. Mildly affected muscle fiber (blue circled area) shows slightly dilated SR. Moderately affected muscle fiber (orange circled area) shows dilated SR. Severely affected muscle fiber (red circled area) shows dilated SR and severely misarranged cytoplasmic structures (arrowhead) (Scale bar = 5 μm)

Microglia proliferation in the hypothalamus of CytoTDP. A Representative dorsal views of segmented whole-brain (top panel) and hypothalamus (lower panel) images using tissue clearing and whole-mount immunostaining of microglia at 5 dpf and 8 dpf. Co-staining against 5-hydroxytryptamine (5-HT) was used as a counterstain for the hypothalamus in zebrafish [38]. Confocal scans of mpeg1.1-eGFP positive microglia (green) and 5-HT (red) CytoTDP and Control larvae. Scale bars = 100 μm. B Quantification of microglia cell number in whole-brain of Control versus CytoTDP larvae at 5 dpf and 8 dpf, 5 dpf Control vs 5 dpf CytoTDP ** p = 0.0012, 8 dpf Control vs 8 dpf * p = 0.0134, n = 10 larvae for each group, unpaired T test, Error bars indicates ± SD. C Quantification of microglia cell number in the hypothalamus of Control versus CytoTDP larvae at 5 dpf and 8 dpf, 5 dpf Control vs 5 dpf CytoTDP ** p = 0.0041, 8 dpf Control vs 8 dpf CytoTDP **** p < 0.0001, unpaired T test, n = 10 larvae for each group, Error bars indicates ± SD

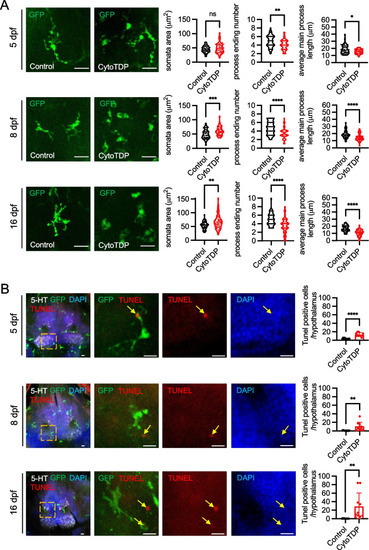
Microglia activation in the hypothalamus of CytoTDP. A Representative images of mpeg1.1-eGFP positive microglia in hypothalamus from Control and CytoTDP at 5 dpf, 8 dpf and 16 dpf. Scale bars = 20 μm. Violin plots show the area of somata, number of main processes, and average main process length of mpeg1.1-eGFP positive microglia in CytoTDP and Control at 5 dpf, 8 dpf and 16 dpf. 5 dpf (somata area p = 0.2165, number of main processes ** p = 0.0068, average main process length * p = 0.0308), 8 dpf (somata area *** p = 0.0008, number of main processes **** p < 0.0001, average main process length **** p < 0.0001), 16 dpf (somata area ** p = 0.003, number of main processes **** p < 0.0001, average main process length **** p < 0.0001), n = 50 cells for each group, unpaired T test. Each point represents one cell. B Representative maximum intensity projections of confocal images of mpeg1.1-eGFP CytoTDP fish after whole-mount immunostaining with tissue clearing and quantifications of TUNEL positive cells in the hypothalamus of CytoTDP fish and Control fish at 5 dpf, 8 dpf and 16dpf. 5-HT, mpeg1.1-eGFP positive microglia, TUNEL and DAPI signals are in gray, green, red and blue, respectively. Colocalization of TUNEL apoptotic DNA fragments, DAPI stained nuclei and microglia processes (yellow arrows) are evident in CytoTDP zebrafish through all the checked time points. Scale bars = 10 μm. 5 dpf Control vs 5 dpf CytoTDP **** p < 0.0001, 8 dpf Control vs 8 dpf CytoTDP ** p = 0.0061, 16 dpf Control vs 16 dpf CytoTDP ** p = 0.0099, unpaired T test, n = 10 larvae for each group, Error bars indicates ± SD

CytoTDP affects key metabolic processes. A Principal component analysis (PCA) of RNA sequencing results showed a strong separation of genotypes among the three groups of zebrafish (TDP DKO, CytoTDP and Control). B Venn diagram representation of the number of differentially expressed genes in TDP DKO (blue) and CytoTDP (red) compared to Control. C Gene ontology analysis of the biological process of genes differentially expressed of TDP DKO and CytoTDP compared to Control, respectively. D Heatmap of significantly mis-regulated genes in carbohydrate metabolic pathways in 1.5 dpf and 5 dpf CytoTDP fish. E Hub genes were identified through Cytoscape, with the color intensity representing the gene's ranking. F Quantification of glycogen concentrations revealed that the glycogen concentrations in 5 dpf CytoTDP embryos (n = 16) were 1.87 fold higher than in Control (n = 16) (****p < 0.0001, Unpaired T test)

Acknowledgments
This image is the copyrighted work of the attributed author or publisher, and ZFIN has permission only to display this image to its users. Additional permissions should be obtained from the applicable author or publisher of the image. Full text @ Mol. Neurodegener.