FIGURE SUMMARY
Title

Bioinformatic Analysis of Roquin Family Reveals Their Potential Role in Immune System

Authors
Li, X., Yang, S., Zhang, X., Zhang, Y., Zhang, Y., Li, H.
Source
Full text @ Int. J. Mol. Sci.

The phylogenetic trees of Roquins between various species constructed by MEGA with two different methods: (A) Neighbor-Joining; and (B) Maximum-Likelihood. Homologous proteins within the same branch are represented by the same color, with darker shades indicating closer evolutionary relationships. Bootstrap values (%), displayed at each node after 1000 replicates, depict the confidence levels of the branching patterns. Hs, Homo sapiens; Mm, Mus musculus; Gg, Gallus gallus; Xt, Xenopus tropicalis; Dr, Danio rerio; Lo, Lepisosteus oculatus; Om, Oncorhynchus mykiss; Tr, Takifugu rubripes; Cc, Carcharodon Carcharias; Cp, Chiloscyllium plagiosum; Ar, Amblyraja radiate; Pm, Petromyzon marinus; Bf, Branchiostoma floridae; Sc, Styela clava; Dm, Drosophila melanogaster; Aq, Amphimedon queenslandica; Ce, Caenorhabditis elegans; Ta, Trichoplax adhaerens.

The exon–intron structure of the RC3H1 and RC3H2 genes between different species. Rectangles represent exons, while lines signify introns; green rectangles denote Untranslated Regions; yellow rectangles indicate Coding Sequences. The scale bar at the bottom provides a reference for gene length.

The collinearity analysis of the RC3H1 and RC3H2 genes between humans and zebrafish. All genes are represented by arrows, with the direction of the arrow indicating the gene’s orientation. The same color of arrows suggests homologous genes between different species. Chr, Chromosome.

The schematic diagrams of the domain composition of ROQUIN-1 and ROQUIN-2 proteins between various species. RING, ROQ, C3H1-Znf, PRR, Q/N-Rich, and CC domains are shown in colored boxes on a grey background, representing the full length of the proteins. Each domain is depicted with a unique color for visualization. Hs, Homo sapiens; Dr, Danio rerio; Bf, Branchiostoma floridae.

Analysis of the protein motifs of ROQUIN-1 and ROQUIN-2 between various species. The motifs are illustrated in colored boxes. The letters within each motif stand for the abbreviations of amino acids. Larger letters signify higher conservation, indicating a greater probability of the amino acid appearing at the same position within the motif between various species. Hs, Homo sapiens; Dr, Danio rerio; Bf, Branchiostoma floridae.

The heatmap displays the expression levels of zebrafish rc3h1a, rc3h1b, and rc3h2 genes between different stages and tissues. All expression levels between different stages (A) and tissues (B) are derived from RNA-seq data. The colors range from dark blue to dark red, reflecting low expression levels to high expression levels.

Analysis of transcription factor binding sites in the promoter regions of the rc3h1 and rc3h2 genes in zebrafish and amphioxi. The two kb promoter regions are shown, with arrows indicating the transcription start site. Different-colored dots represent the binding sites of different transcription factors. Note that there are sequences in the promoter of the zebrafish rc3h2 gene that contain multiple overlapped binding sites for Gata2.

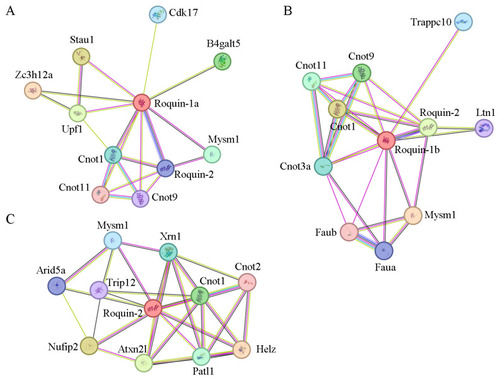
Protein–protein interaction network analysis of Roquin-1a, Roquin-1b, and Roquin-2 in zebrafish. (A) Protein–protein interaction network analysis of Roquin-1a. (B) Protein–protein interaction network analysis of Roquin-1b. (C) Protein–protein interaction network analysis of Roquin-2. Network nodes represent proteins.

The schematic diagram shows the 3’-UTR region of multiple genes containing CDE-like motifs. (A) Secondary structure model of CDE-like motif. (B) Genes containing the CDE-like motif identified in zebrafish; this motif presents in the 3’-UTR region of mRNAs. Red nucleotides represent 100% conservation, marked with * at the bottom. N refers as an undefined nucleotide.

Acknowledgments
This image is the copyrighted work of the attributed author or publisher, and ZFIN has permission only to display this image to its users. Additional permissions should be obtained from the applicable author or publisher of the image. Full text @ Int. J. Mol. Sci.