
- Title
-
Visualising Neutrophil Actin Dynamics in Zebrafish in Response to Laser Wounding Using Two-Photon Microscopy
- Authors
- Williantarra, I., Georgantzoglou, A., Sarris, M.
- Source
- Full text @ Bio Protoc
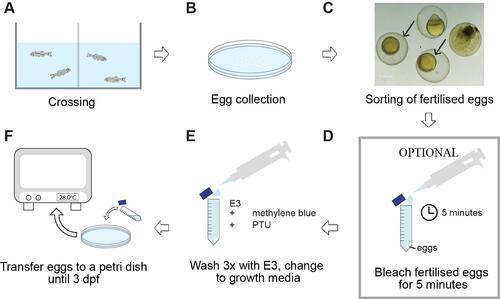
Diagram of the general workflow for the crossing and rearing procedures described in this paper. Adult zebrafish are set up for crossings in tanks and fit with a spawning mesh and a barrier separating the male from the female (A). For the crossing event, the barrier is removed in the morning. Eggs are collected at a maximum of 3 h later (B), followed by sorting of fertilised (arrowed) from non-fertilised eggs (C). To prevent mould or bacterial infection, embryos may be treated with a bleach solution, followed by three times washing with E3 medium (D). Finally, eggs are incubated at 28 °C in E3 supplemented with methylene blue to help prevent fungal and bacterial growth and PTU to prevent pigmentation (E, F). dpf = days post-fertilisation; PTU = 1-phenyl-2-thiourea. |

Schematic diagram and representative images of the mounting process for laser wounding. Low-melting point (LMP) agarose is used to keep live embryos in place for an extended period of time. Larvae at 3 dpf with the strongest signal are anaesthetised with 1× MS-222 (A), screened for red (Lifeact-Ruby) fluorescent signal (B), and mounted onto (D–G) a glass-bottom plate in 1.2% LMP agarose. Once the larvae have been pipetted into the agarose (E), the larvae must be quickly (F) positioned and aligned, as the agarose will start to solidify within 1–2 min. After 10 min, agarose-embedded embryos are covered with E3 medium supplemented with MS-222 and any optional molecules, such as LTB4, and (G) imaged using a two-photon microscope. MS-222 = 3-amino benzoic acid ethyl ester; LTB4 = Leukotriene B4. |

Schematic of a 3 dpf zebrafish larva showing the area of a two-photon laser wound and its representative field of view. Shown are a schematic of the anatomical area imaged (A) and the image projections before (B), during (C), and after (D) laser wounding. Neutrophils in a Tg(lyz:Lifeact Ruby) larva are shown (red fluorescence channel). CHT = caudal hematopoietic tissue; LW = laser wound; VF = ventral fin. Scale bar represents 50 μm. Note that upon laser wounding, the tissue becomes autofluorescent. |

Analysis of neutrophils and calculation of Lifeact polarity with time. A. Outline (red line) of an example of a segmented neutrophil within a Tg(mpx:Lifeact-Ruby) transgenic larva. Scale bar = 10 μm. B. Neutrophil velocity vector (arrow) determines the direction of movement. C. Automated separation of the front (F) and rear (R) part of the cell; in the left image, Lifeact is concentrated at the front part (t0) while in the right image, Lifeact is concentrated at the rear part (t1). Arrows indicate the direction of motion. Scale bar = 10 μm. D. Neutrophil Lifeact polarity, in relation to time; time sequence was synchronised based on the time of the laser wounding. Adapted from Figures 2 and 3 in Georgantzoglou et al. [9]. |