
- Title
-
Teleost Hox code defines regional identities competent for the formation of dorsal and anal fins
- Authors
- Adachi, U., Koita, R., Seto, A., Maeno, A., Ishizu, A., Oikawa, S., Tani, T., Ishizaka, M., Yamada, K., Satoh, K., Nakazawa, H., Furudate, H., Kawakami, K., Iwanami, N., Matsuda, M., Kawamura, A.
- Source
- Full text @ Proc. Natl. Acad. Sci. USA
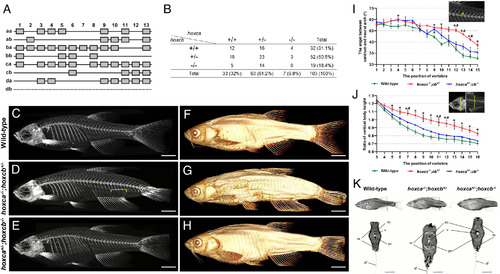
Zebrafish hoxca−/−;hoxcb+/− mutants retain more anterior features in the posterior body. (A) Zebrafish possess 49 hox genes in seven hox clusters. hox clusters such as hoxaa and hoxab were duplicated by TS-WGD. (B) Genotyping of juvenile fish at 1 to 2 mo of age obtained from several intercrosses of hoxca+/−;hoxcb+/− fish. (C–H) Micro-CT scan images of WT fish (n = 3), hoxca−/−;hoxcb+/− mutants (n = 4), and hoxca+/−;hoxcb−/− mutants (n = 3). The images show the whole skeleton (C–E) and the surface structure (F–H) of the fish. In hoxca−/−;hoxcb+/− mutants, the radials connecting the vertebrae to the rays of the anal fin are elongated in a different direction than normal, as indicated by the bracket in (D). The average number of the fin ray is 15.3 in WT, 18.0 in hoxca−/−;hoxcb+/−, and 14.7 in hoxca+/−;hoxcb−/−fish. The average number of the radial is 12.3 in WT, 17.8 in hoxca−/−;hoxcb+/−, and 12.7 in hoxca+/−;hoxcb−/−fish. Movies S1 and S2 are available. (Scale bar, 3 mm.) (I and J) Comparison of the angle between the neural arch and the centrum (I) and the vertical body height (J). The measurements are briefly shown in the Upper Right diagrams. For more information, see Materials and Methods. The position of the vertebra connecting to the most anterior fin ray of the anal fin via the radial is defined as 1. Multiple comparison analysis was performed using the Tukey–Kramer test. Significant differences (P < 0.05) between WT and hox mutants are indicated with *. Significant differences (P < 0.05) between the two hox cluster-deficient mutants are indicated by #. (K) CT sections showing the internal structures. Transverse sections of each mutant are shown at a position indicated by the vertical line corresponding to vertebra 10 in (I and J). Continuous transverse CT sections of the trunk and tail are shown in Movie S3. (Scale bar, 1 mm.) af: anal fin, m: myotome, sc: spinal cord, pv: posterior vein, v: vertebra. |

The regional identities posterior to the zebrafish anal fin are defined stepwise by hoxc12 and hoxc13. (A) Expression patterns of hoxc11-13 genes in 30 hpf embryos. The dashed line indicates the position of the cloaca, and the arrowhead indicates the anterior border of hox expression in the somites. (Scale bar, 100 μm.) (B–E) Skeletons of juvenile and adult fish. Calcein staining was used to visualize the skeletons of juvenile fish (SL 7.5 to 8.5 mm; n = 6 for each mutant). (Scale bar, 500 μm.) (B’-E’) X-ray micro-CT scans of adult fish (n = 3 for each mutant). 3D movies are available with Movies S4–S6. (Scale bar, 3 mm.) (F and G) Comparison of the number of fin rays in the anal fin (F) and dorsal fin (G). (H) Comparison of the anterior and posterior ends of vertebrae attached to the fin rays of the anal fin (H) through the radials. The anterior end of the vertebra is marked with a circle, and the posterior end is marked with a rectangle. (I) Comparison of the number of vertebrae. Statistical analysis was performed using data collected from six calcein-stained juvenile fish. The Tukey–Kramer test was performed with *P < 0.05, **P < 0.01, ***P < 0.001, and ****P < 0.0001. (J–L) The finfold to fin formation in each mutant (n = 4 for each mutant). Brightfield and calcein-stained images are merged. Arrowheads indicate the anteriormost part of the ventral finfold where regression was observed. (Scale bar, 500 μm.) |

The regions competent for the formation of zebrafish dorsal and anal fins are encompassed by hox genes. (A–C) Calcein staining was used to visualize the skeletons of juvenile fish (SL 7.5 mm to 8.5 mm). (Scale bar, 500 μm.) (A’–C’) X-ray micro-CT scans of adult fish. 3D movies are provided in Movies S7 and S8. (Scale bar, 3 mm.) (D) Comparison of the number of fin rays in the dorsal fin. (E) Comparison of the anterior and posterior ends of the vertebrae attached to the fin rays of the dorsal fin through the radials. The anterior end of the vertebra is marked with a circle, and the posterior end is marked with a rectangle. (F) Comparison of the number of vertebrae. Statistical analysis was performed using data collected from six calcein-stained juvenile fish. The Tukey–Kramer test was conducted. **P < 0.01, ***P < 0.001, and ****P < 0.0001. (G and H) The finfold to fin formation in hoxc11a;c11b and hoxc11a;c12a;c13a;c11b;c12b;c13b mutants (n = 4 for each mutant). Brightfield and calcein-stained images are merged. (Scale bar, 500 μm.) (I and J) Expression pattern of GFP signals in Tg(gSAIGFF30A); Tg(UAS:GFP) larvae. (Scale bar, 250 mm.) (K and L) Micro-CT scan images of WT and hoxab+/−;hoxda−/− cluster mutant fish. (Scale bar, 3 mm.) (M) Expression patterns of hoxab and hoxda genes in 30 hpf WT embryos. The dashed line indicates the position of the cloaca, and the arrowhead indicates the anterior border of the hox expression in the somites. (Scale bar, 100 mm.) (N and O) Skeletons were visualized by calcein staining in hoxa10b;d10a and hoxa9b;a10b;d9a;d10a mutant juvenile fish. (Scale bar, 500 μm.) (P) Models of how multiple hox genes define regional identities in the zebrafish posterior body, including the dorsal and anal fins. |
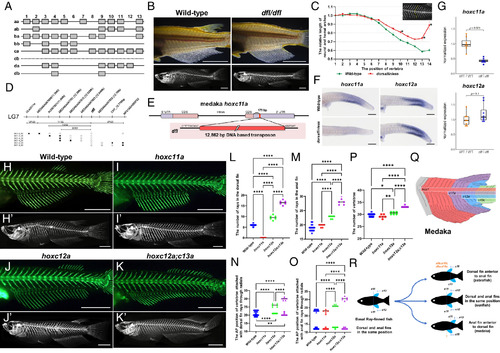
hox genes responsible for the formation of the anterior dorsal fin are not orthologous between zebrafish and medaka. (A) Medaka possess 46 hox genes in seven hox clusters. (B) The posterior body (Top) and whole skeletal structures by micro-CT scanning (Bottom) of WT (n = 3) and dfl (n = 3) adult fish. (Scale bar, 3 mm.) 3D movies are available with Movies S9 and S10. (C) Relative length of neural and hemal arches between WT and dfl medaka. The measurement is briefly shown in the Upper Right diagram. For more information, see Materials and Methods. The vertebra to which the anteriormost ray of the anal fin was attached was defined as vertebra 1. Two-sample t test was performed with *P < 0.05. (D) Recombinant panel of the dfl mutants. dfl homozygotes are represented by white squares and heterozygotes by black squares. (E) Insertion of transposon-like element into hoxc11a 3′UTR. (F) Whole-mount in situ hybridization shows the expression patterns of hoxc11a and hoxc12a between WT and dfl mutants. (Scale bar, 100 μm.) (G) qPCR analysis of normalized expression of hoxc11a and hoxc12a mRNA between WT and dfl mutants. The Mann–Whitney U test was performed. (H–K) Calcein staining to visualize the skeletons of hox mutant juvenile medaka. (H’–K’) X-ray micro-CT scan images of adult medaka (n = 3 for each mutant). Genotyping of these mutants is shown in SI Appendix, Table S5. 3D movies are available with Movies S11–S13. (Scale bar, 3 mm.) (L and M) Comparison of the number of fin rays in the dorsal fin (L) and anal fin (M). (N and O) Comparison of the anterior and posterior ends of the vertebrae attached to the fin rays of the dorsal fin (N) or anal fin (O) through the radials. The anterior end of the vertebra is marked with a circle, and the posterior end is marked with a rectangle. (P) Comparison of the number of vertebrae. Statistical analysis was performed using data collected from six calcein-stained juvenile medaka. The Tukey–Kramer test was performed with *P < 0.05, **P < 0.01, ***P < 0.001, and ****P < 0.0001. (Q) Models of how multiple hox genes define the formation-competent regions of the dorsal and anal fins in medaka in the posterior body. (R) Hypothesis of the evolutionary scenario in the Hox patterning system of the dorsal and anal fins in the ray-finned fishes. |