
- Title
-
A β-catenin chromobody-based probe highlights endothelial maturation during vascular morphogenesis in vivo
- Authors
- Gauvrit, S., Zhao, S., Rothbauer, U., Stainier, D.Y.R.
- Source
- Full text @ Development

The endothelial-specific β-catenin chromobody exhibits expression in endothelial nuclei and cell-cell junctions and can be used to monitor junctional maturation during zebrafish development. (A) Schematic of the fli1a:EGFP-BC1 construct. (B-E) Trunk vasculature of Tg(fli1a:EGFP-BC1) zebrafish from 24 to 96 hpf. Chromobody expression localizes to endothelial nuclei (red arrows) and at cell membranes (red arrowheads). (F) Junctional linearity index at 48 (n=32 junctions from six embryos), 72 (n=30 junctions from six larvae) and 96 (n=44 junctions from seven larvae) hpf. Data are mean±s.d.; P-value calculated using an unpaired two-tailed Student's t-test. (G) Single plane spinning disc confocal image of a single endothelial cell during CCV formation at 36 hpf. The β-catenin chromobody exhibits a dynamic localization (see Movie 1), especially at endothelial cell-cell junctions; interactions of red blood cells with endothelial cells can also be observed (red arrowheads point to endothelial cell-cell junctions; black arrowhead points to a red blood cell interacting with an endothelial cell). Scale bars: 40 μm (B-E); 10 μm (G). |

β-Catenin chromobody expression in endothelial nuclei. (A-C) Confocal images of immunostaining (GFP, white; β-catenin, magenta) and counterstaining for DNA (DAPI, blue) of Tg(fli1a:EGFP-BC1) embryos at 48 hpf. β-Catenin immunostaining coincides with the chromobody localization at the endothelial cell-cell junctions (red arrowheads point to endothelial cell-cell junctions, blue arrowheads to non-endothelial β-catenin immunostaining). (D-G) Lateral views and quantification of fluorescence intensity of the nuclear signal in dorsal aorta endothelial cells of 48 hpf Tg(fli1a:EGFP-BC1); Tg(kdrl:NLS-mCherry) embryos after exposure to the indicated GSK3β inhibitor starting at 24 hpf (non-treated, n=166 nuclei from six embryos; CHIR, n=305 nuclei from 12 embryos; LiCl, n=311 nuclei from 12 embryos). Treatment with either GSK3β inhibitor increases the nuclear signal of the Tg(fli1a:EGFP-BC1) chromobody. Data are mean±s.d. P<0.0001 calculated using a one-way ANOVA (post hoc Tukey's test). Red arrowheads point to endothelial nuclei. Scale bars: 40 μm (A-C), 10 μm (D-F). |

Membrane localization of the endothelial-specific β-catenin chromobody is dependent on Cdh5 expression and blood flow. (A-C) Confocal images of immunostaining (GFP, white; Cdh5, magenta) of Tg(fli1a:EGFP-BC1) embryos at 48 hpf. Cdh5 co-localizes with the chromobody at the endothelial cell-cell junctions (red arrowheads). (D) Trunk vasculature of Tg(fli1a:EGFP-BC1); cdh5−/− embryos at 50 hpf. cdh5 mutants mostly lack blood flow and display a lack of localization of the β-catenin chromobody at endothelial cell-cell junctions (asterisks indicate a collapsed dorsal aorta due to the lack of blood flow). (E,F) Trunk vasculature of 50 hpf Tg(fli1a:EGFP-BC1) embryos injected at the one-cell stage with 0.5 ng control MO (E) or 0.5 ng cdh5 MO (F). cdh5 morphants display a lack of localization of the β-catenin chromobody at endothelial cell-cell junctions while blood flow is not affected (arrowheads point to β-catenin chromobody localization at endothelial cell-cell junctions; asterisks indicate a lack of localization of the β-catenin chromobody at endothelial cell-cell junctions). (G,H) Trunk vasculature of Tg(fli1a:EGFP-BC1); tnnt2a+/+ and Tg(fli1a:EGFP-BC1); tnnt2a−/− (tnnt2amn0031Gt/mn0031Gt) larvae at 72 hpf. tnnt2a mutants display a lack of blood flow, and the localization of the β-catenin chromobody at endothelial cell-cell junctions is missing. (G′,H′) High-magnification images of boxed areas in G and H, showing the dorsal aorta. Arrowheads point to β-catenin chromobody localization at endothelial cell-cell junctions; asterisks indicate a lack of localization of the β-catenin chromobody at endothelial cell-cell junctions. Scale bars: 40 μm. |
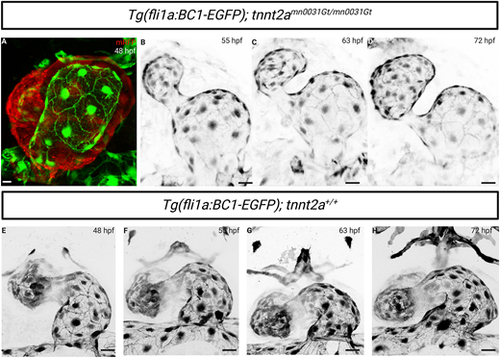
Endocardial expression of the endothelial-specific β-catenin chromobody in tnnt2a mutants. (A) Confocal imaging of a 48 hpf Tg(fli1a:EGFP-BC1); tnnt2a−/− atrium; mRFP expression corresponds to the tnnt2a gene trap expression. The endothelial-specific β-catenin chromobody is localized at endocardial cell-cell junctions in tnnt2a−/−. (B-D) Confocal time-lapse images of a Tg(fli1a:EGFP-BC1); tnnt2−/− atrium at 55, 63 and 72 hpf from Movie 3. Localization of the endothelial-specific β-catenin chromobody is maintained at endocardial cell-cell junctions despite the lack of blood flow. (E-H) Confocal time-lapse images of a Tg(fli1a:EGFP-BC1); tnnt2a+/+ atrium at 48, 55, 63 and 72 hpf. Scale bars: 20 μm |