FIGURE SUMMARY
Title

The physical and cellular mechanism of structural color change in zebrafish

Authors
Gur, D., Moore, A.S., Deis, R., Song, P., Wu, X., Pinkas, I., Deo, C., Iyer, N., Hess, H.F., Hammer, J.A., Lippincott-Schwartz, J.
Source
Full text @ Proc. Natl. Acad. Sci. USA

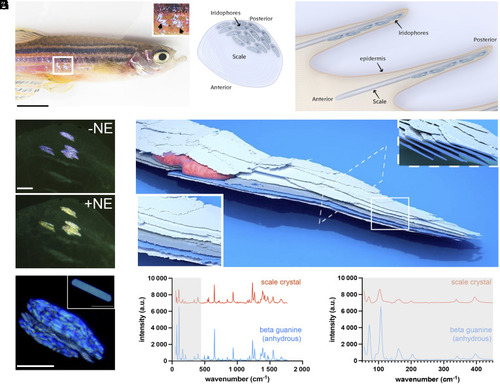
Anatomy, crystal properties, and color change capabilities of the zebrafish scale iridophores. (A) The flank of an adult zebrafish. The Top Inset shows a closeup of the reflectance of individual scale iridophores (marked with black arrows). (B and C) Schematic illustration of a zebrafish scale and tissue showing a Top view of an isolated scale in which iridophores are located adjacent to the scale on its posterior side (B), and a side view (cross-section) showing the scales within the fish dermis in which iridophores are located adjacent to the scales (C). (D) Scale iridophores before (Top) and after (Bottom) NE-treatment display violet-blue and yellow reflectance, respectively. (E) 3D rendering of FIB-SEM serial-sectioning of a scale iridophore showing an array of thin intracellular crystals arranged in parallel (highlighted by pseudocoloring in blue and gray; the cell’s nucleus is pseudocolored red). The Bottom Left Inset shows a higher magnification view of the parallel crystal arrays, while the Top Right Inset shows a perpendicular view of the crystal arrays. (F) Detected reflectance (blue) under the light microscope from scale iridophores. The Top Inset shows a single crystal isolated from a scale iridophore (G) In situ micro-Raman spectra obtained from scale iridophores (red spectrum), together with a reference spectrum for anhydrous β guanine (blue spectrum). (H) The low-wavenumber region of the samples examined in (G). (Scale bars, (A) 3 mm, (D) 80 µm, (F) 40 µm.)

NE-induced changes in crystal tilt, crystal spacing, and cellular optical properties. (A) Top panel: representative FIB-SEM section (XZ plane) of an untreated iridophore. Bottom panel; representative FIB-SEM section (XZ plane) of a NE-treated iridophore. (B) Optical properties of untreated (blue curve) and NE-treated iridophores (yellow curve) compared to the corresponding Monte Carlo simulations (dotted for untreated, dashed for NE treated). (Scale bar, (A) 500 µm.)

Color change in scale iridophores is driven by the tilting of crystals. (A) Iridophores are typically blue before NE treatment (Left), red 4 min after NE addition (Middle), and finally yellow 7 min after NE addition (Right) (these two shifts were seen in 6 out of 10 scales from three different fish). Insets show representative colors for each time point. (B) A schematic showing the X-ray diffraction experimental setup, where a change in the tilt orientation of crystals results in a change in the (Δω) of the diffraction spot. (C) Pseudotemporal colored representation of 32 diffraction spots over a 7-min period following NE addition. (Scale bar, (A) 10 µm.)

Microtubules and the microtubule minus end-directed motor protein dynein drive NE-induced color change. (A) JF549-labeled iridophores (Left) and corresponding kymographs of untreated (Top), nocodazole-treated (Middle), and NE-treated cells (Bottom). Kymograph Insets are contrasted for clarity. (B) Microtubule distribution visualized using an anti-α-tubulin antibody in an iridophore (arrow) and an adjacent dermal cell (arrowhead). (C) Iridophore in a scale after 10 min of recovery from nocodazole treatment (anti-α-tubulin, cyan; crystals autofluorescence, magenta). (D) TEM image of an iridophore showing ~25 nm tubes running parallel to the crystals. (EH) Graphs showing the blue-to-red channel ratio (the deconvoluted components of an RGB movie) of iridophores treated with NE (E), nocodazole + NE (F), dynapyrazole-a + NE (G) and adenosine (H). (Scale bars, (A, Left) 4 µm, (A, Right) 10 µm, (B) 8 µm, (C) 5 µm, (D) 400 nm.)

Acknowledgments
This image is the copyrighted work of the attributed author or publisher, and ZFIN has permission only to display this image to its users. Additional permissions should be obtained from the applicable author or publisher of the image. Full text @ Proc. Natl. Acad. Sci. USA