FIGURE SUMMARY
Title

The reference genome of Macropodus opercularis (the paradise fish)

Authors
Fodor, E., Okendo, J., Szabó, N., Szabó, K., Czimer, D., Tarján-Rácz, A., Szeverényi, I., Low, B.W., Liew, J.H., Koren, S., Rhie, A., Orbán, L., Miklósi, Á., Varga, M., Burgess, S.M.
Source
Full text @ Sci Data

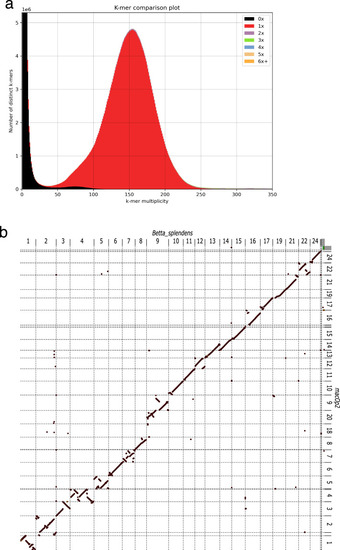
Basic genome assessment. (a) K-mer comparison plot showing copy number of the k-mers as a stacked histogram colored by the copy numbers found in the paradise fish draft genome assembly. The y-axis represents the number of distinct k-mers, and the x-axis shows the k-mer multiplicity (coverage). Most k-mers are represented once (red peak) indicating high quality for the genomic assembly. (b) Whole genome alignment of the B. splendens genome assembly to the M. opercularis assembly. B. splendens is on the X-axis and M. opercularis on the Y-axis. B. splendens chromosomes 9 appears to map to two separate M. opercularis chromosomes and M. opercularis chromosome 18 does not appear to have a clear homologous chromosome in B. splendens. Chromosome numbering is based on B. splendens alignment to medaka chromosomes14,20.

Distribution of intron sizes for various species of fish. M. opercularis is at the low end of the spectrum for fish genome size, similar to puffer fish species. The line denotes the linear regression line fitted over the data. Grey areas denote the 0.95 confidence interval of the fit. The diameter of the circles correlates to the approximate gene count (20 to 50 thousand).

Comparison of predicted proteins across 4 species shows the close relationships between M. opercularis and B. splendens. (a) Evolutionary relationship between paradise fish, Siamese fighting fish, zebrafish, and Japanese medaka. (b) The number of genes per species that could be placed in an orthogroup (the set of genes descended from a single gene in the last common ancestor of all the species). This value is close to 90% for all four species. (c) The number of orthogroups that are specific to each species. (d) The total number of transcripts with orthologs in at least one other species. (e) Heat map of the orthogroups for each species pair (top) and orthologs between each species (bottom). The relative evolutionary distances between the different species are consistent with the overall levels of gene conservation.

Acknowledgments
This image is the copyrighted work of the attributed author or publisher, and ZFIN has permission only to display this image to its users. Additional permissions should be obtained from the applicable author or publisher of the image. Full text @ Sci Data