
- Title
-
Epigenetic and physiological alterations in zebrafish subjected to hypergravity
- Authors
- Salazar, M., Joly, S., Anglada-Escudé, G., Ribas, L.
- Source
- Full text @ PLoS One

|

Survival rates of control and hypergravity zebrafish larvae during 5 days of treatment. Each data point shows the mean ± SE of six independent groups with a total number of 220 individuals per condition (control and hypergravity). The cumulative survival with different letters indicates a significant difference (P < 0.005) according to the Least significant difference (LSD) test. |

Hatching rate of larvae at 2- and 3-days post fertilization treated with hypergravity compared with the control group. Six biological replicates were made, with a total number of larvae of 220 and 220 in control and hypergravity, respectively. Data are presented as percentage ± standard error of the mean (SEM). Normality was evaluated with a Kolmogorov–Smirnov test, and Levene’s test was used to assess homoscedasticity of variances. No differences between groups were found according to Least significant difference (LSD) test. |

Ethogram analysis consisted on identifying three locomotor characteristics: Position |

Teratology was observed at 5 days post fertilization (dpf) in zebrafish larvae exposed to ~3 Positions of the larvae are shown in the figure: horizontal (A), vertical ascendant (B); horizontal lateral (C); and vertical descendent (D). Teratologies included four major types: body curvature (B), abnormal eye size (B), overall body deformation (C) and tail curvature (D). |
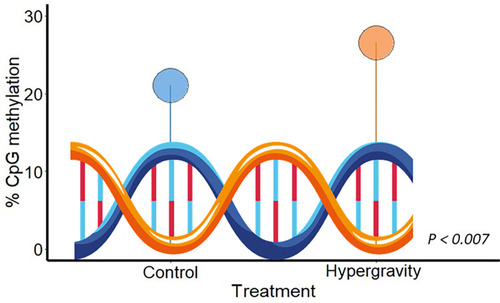
Global DNA methylation in zebrafish larvae after 5 days of ~3 N = 10 larvae per group (control and hypergravity). The statistical analysis was conducted using a two-tailed t-test (p < 0.05), demonstrating a significant difference in DNA methylation levels between the control and hypergravity conditions. Each lollipop represents the percentage of methylation in control and hypergravity conditions. |

Expression of three epigenetic-related genes in zebrafish larvae after 5 days of ~3 Data are shown as mean ± SEM of fold change Relative Expression = 2^(-ΔCt) using control values set at 1. N = 10 larvae per group (control and hypergravity). No significant differences were found. |