
- Title
-
Improvement in Tol2 transposon for efficient large-cargo capacity transgene applications in cultured cells and zebrafish ( Danio rerio)
- Authors
- Wang, P.C., Deng, H., Xu, R., Du, J.L., Tao, R.
- Source
- Full text @ Zool Res

Design of improved Tol2 transposases with enhanced expression and nuclear targeting A: Schematic of modified Tol2 transposase design. Tol2 transposase is driven by the CMV promoter and engineered for enhanced expression and nuclear targeting by incorporating the QBI SP163 translational enhancer and H2B. B: Fluorescence microscopy images of H1299 cells transfected with EGFP-fused Tol2 transposase constructs: T (wild-type Tol2), ST (SP163-Tol2), and SHT (SP163-H2B-Tol2). Cells were fixed and stained with DAPI to visualize nuclei. Scale bars, 20 μm. C, D: Quantification of normalized EGFP fluorescence intensity in total cell cytosol (C) and nuclei (D). Data are mean±SEM. n=3 independent experiments. *: P<0.05; **: P<0.01; ***: P<0.001; ****: P<0.0001. Student’s unpaired t-test. |

Characterization of different Tol2 transposases in transfected H1299 cells A: Schematic of transposition efficiency of super PiggyBac (sPB) and various Tol2 transposases. Efficiency was assessed through co-transfection of transposon and donor plasmids, followed by quantification of cell clones and FACS analysis. B: Comparison of sPB with different Tol2 transposases based on efficacy of stable transgene integration. Analysis was conducted at various transposon plasmid dosages while maintaining a constant donor plasmid dosage. C: Quantification of stable integrated cell ratios for sPB, T, and ST at a transposase/donor plasmid ratio of 1:10 using FACS analysis. n=3 independent experiments. |
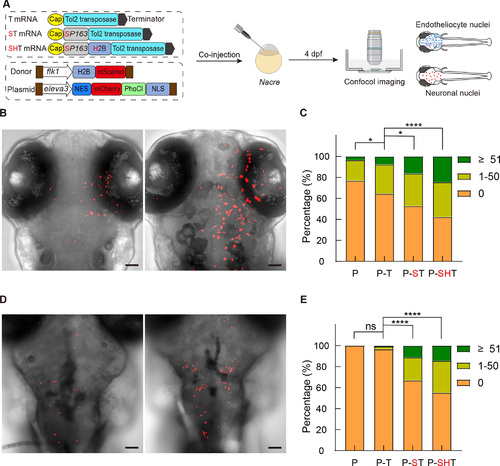
Characterization of transposition efficiency of different Tol2 transposases in zebrafish A: Schematic of measurement of in vivo transposition efficiencies of various Tol2 transposases with two different donor plasmids carrying 8 kb and 14 kb cargo, respectively. dpf: Days post-fertilization. B, C: Representative images of F0 embryos showing patterns of mScarlet-positive endothelial cell nuclei (left, Group 2; right, Group 3) observed in 4 dpf larval zebrafish (B). Categorization was based on number of red fluorescent cells in larval zebrafish: (1) Group 1: No fluorescent cells; (2) Group 2: 1–50 fluorescent cells; (3) Group 3: No less than 51 fluorescent cells. P: Only donor plasmid; P-T, P-ST, P-SHT: Co-injection of donor plasmid with Tol2, SP163-Tol2, and SP163-H2B-Tol2 mRNA, respectively (C). Total fish numbers (n) were 117, 104, 110, and 184 for P, P-T, P-ST and P-SHT, respectively. D, E: Representative images (D) and corresponding statistical results (E) depicting Tol2 transposase-dependent transgenesis for labeling neuronal nuclei in 4 dpf larval zebrafish. Total fish numbers (n) were 101, 150, 127, and 125 for P, P-T, P-ST and P-SHT, respectively. Scale bars in 3B and 3D: 50 μm. ns: Not significant; *: P<0.05; ****: P<0.0001. Chi-square test for trend. |

Transposition of whole luciferin metabolic pathway in zebrafish A: Schematic of measurement of in vivo transposition efficiencies of modified Tol2 transposases with a donor plasmid carrying the whole luciferin synthetic pathway (24 kb). dpf: Days post-fertilization. B, C: Confocal images of F0 embryos showing patterns of mScarlet-positive cell cytoplasm (top, Group 2; bottom, Group 3) in 4 dpf larval zebrafish. Enlarged views of boxed areas are shown on the right (B). Categorization was based on number of red fluorescent cells in larval zebrafish. P-T: Tol2 mRNA (n=103), P-SHT: SP163-H2B-Tol2 mRNA (n=119) (C). Scale bars in 4B: left, 50 μm; right, 10 μm. **: P<0.01. Chi-square test for trend. |